file_sd_configsを試してみる
Version
prometheus server: 1.8.0
参照
static_configとfile_sd_configsの違い
static_configsの場合は監視対象追加後にprometheus serverの再起動が必要になる。
file_sd_configsの場合は監視対象を追加したあと一定時間(デフォルトは5分)ののちに設定が自動的に読み込まれ、ただちに監視対象に組み込まれる。
targetsのリストをprometheus.yml(デフォルトの名称)に直接かくのではなく別のファイルに書いておいて、file_sd_configの中でそのファイルを指定することでtargetsを読み込んでくれる。- filesとして読み込むパスは、実行ディレクトリからの相対パスなので、./prometheusと実行するんであれば- filesはファイル名だけでよい。
設定例
prometheus.yml
prometheus.ymlにfile_sd_configsの設定を記載した例
prometheus.yml
# my global config
global:
  scrape_interval:     15s # Set the scrape interval to every 15 seconds. Default is every 1 minute.
  evaluation_interval: 15s # Evaluate rules every 15 seconds. The default is every 1 minute.
  # scrape_timeout is set to the global default (10s).

  # Attach these labels to any time series or alerts when communicating with
  # external systems (federation, remote storage, Alertmanager).
  external_labels:
      monitor: 'codelab-monitor'

# Load rules once and periodically evaluate them according to the global 'evaluation_interval'.
rule_files:
  # - "first.rules"
  # - "second.rules"
  - 'prometheus.rules'

# A scrape configuration containing exactly one endpoint to scrape:
# Here it's Prometheus itself.
scrape_configs:
  # The job name is added as a label `job=<job_name>` to any timeseries scraped from this config.
  - job_name: 'prometheus'
    # metrics_path defaults to '/metrics'
    # scheme defaults to 'http'.
    static_configs:
      - targets: ['localhost:9090']

  - job_name: 'file_sd' # 任意の名前
    file_sd_configs:
      - files: # 複数のファイルを読み込ませることができる。
        - /usr/local/prometheus-server/file_sd1.yml
        - /usr/local/prometheus-server/file_sd2.yml
files
filesの記載例
/usr/local/prometheus-server/file_sd1.yml
- targets:
    - 192.168.10.10:9100
    - 192.168.10.11:9100
    - 192.168.10.12:9100
  labels:
    service: web
    role: role-1

- targets:
    - 192.168.20.10:9100
    - 192.168.20.11:9100
    - 192.168.20.12:9100
  labels:
    service: db
    role: role-2
状態確認
prometheus.ymlで設定したjob_name: 'file_sd'で、- filesの中身のtargetsにラベルがついた状態で監視対象に組み込まれたのを確認できた。
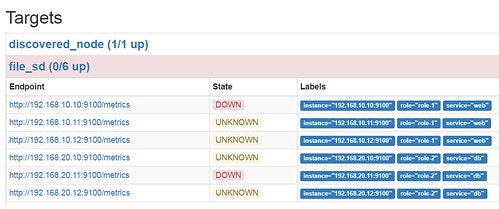
ここに手動で対照を追加する、あるいは対照を定期的に組み込むcron処理でも追加すれば、一応はautocalingに対応する設定となる。