# Prometheus Advent Calendar 2017 9日目
の記事です
# 概要
Prometheus 1.8と2.0ではストレージの互換性がありません。データ移行はできませんが、remote_read設定を使うことで1.8で保管していたデータを2.0側で参照することは可能です。その動きを検証してみました。
# 環境
- EC2インスタンス RHEL 7.4 t2.micro
- Prometheus 1.8
- Prometheus 2.0
- node_exporter 0.15.2
# 前提
1.8から2.0へのMigrationに関する公式ドキュメントに従って作業してみます。
- Prometheus 1.8が動作中で、収集済みのデータが存在している。
- Prometheus 1.8/2.0は同一インスタンスで起動させます。(推奨構成)
- exporterはnode_exporterを使います。
- node_exporterも同一インスタンス上で稼働させます。(別インスタンスを用意するのが面倒だったので。)
# 手順
以下のような手順で。
- 準備
- Prometheus 1.8のconfig.fileを編集
- スクレイプの設定を消しておく
- Prometheus 2.0のconfig.fileを編集
- 1.8時代の監視機能と同様な監視を実現するための設定を入れておく
-
remote_read設定を追加する
- Prometheus 1.8のconfig.fileを編集
- Prometheus 1.8の停止と起動
- Prometheus serverを一旦停止する
-
-web.listen-addressオプションを付けて起動する - スクレイピングされていないことを確認
- Prometheus 2.0の起動
- 1.8の再起動から2.0起動までの間はスクレイプできない前提。
# 準備
## Prometheus 1.8のconfig.fileを編集
ノンスクレイピングな状態にしたいので、global設定以外をコメントアウトしてました。
# my global config
global:
  scrape_interval:     15s # Set the scrape interval to every 15 seconds. Default is every 1 minute.
  evaluation_interval: 15s # Evaluate rules every 15 seconds. The default is every 1 minute.
  # scrape_timeout is set to the global default (10s).

  # Attach these labels to any time series or alerts when communicating with
  # external systems (federation, remote storage, Alertmanager).
  external_labels:
      monitor: 'codelab-monitor'

# Load rules once and periodically evaluate them according to the global 'evaluation_interval'.
rule_files:
  # - "first.rules"
  # - "second.rules"

# A scrape configuration containing exactly one endpoint to scrape:
# Here it's Prometheus itself.
# scrape_configs:
  # The job name is added as a label `job=<job_name>` to any timeseries scraped from this config.
#  - job_name: 'prometheus'

    # metrics_path defaults to '/metrics'
    # scheme defaults to 'http'.

#    static_configs:
#      - targets: ['localhost:9090']
## Prometheus 2.0のconfig.fileを編集
2.0に移行するにあたり、現行の監視機能がもれなく移行されるように旧config.fileの設定をもとに2.0のconfig.fileを編集します。configの内容によってはフォーマットが変更されている可能性もあるので、1.8と2.0の変更点を確認しながらconfig.fileの移行を完了させる。
今回は簡易なテストなので、同一インスタンスで稼働しているnode_exporter(localhost:9100)のターゲット設定と、remote_read設定をデフォルトのprometheus.ymlに追記します。
node_exporterの設定はscrapte_configの中に記載。
remote_read設定はconfig.fileの末尾に記載しています。
# my global config
global:
  scrape_interval:     15s # Set the scrape interval to every 15 seconds. Default is every 1 minute.
  evaluation_interval: 15s # Evaluate rules every 15 seconds. The default is every 1 minute.
  # scrape_timeout is set to the global default (10s).

# Alertmanager configuration
alerting:
  alertmanagers:
  - static_configs:
    - targets:
      # - alertmanager:9093

# Load rules once and periodically evaluate them according to the global 'evaluation_interval'.
rule_files:
  # - "first_rules.yml"
  # - "second_rules.yml"

# A scrape configuration containing exactly one endpoint to scrape:
# Here it's Prometheus itself.
scrape_configs:
  # The job name is added as a label `job=<job_name>` to any timeseries scraped from this config.
  - job_name: 'prometheus'

    # metrics_path defaults to '/metrics'
    # scheme defaults to 'http'.

    static_configs:
      - targets: ['localhost:9090']

  - job_name: 'node_exporter'
    static_configs:
      - targets: ['localhost:9100']

# Settings related to the experimental remote read feature.
remote_read:
  - url: "http://localhost:9094/api/v1/read"
# Prometheus 1.8の起動と停止
config.fileの準備ができたので、Prometheus serverの落としあげをして設定を反映させます。
## Prometheus 1.8の停止
1.8に-web.listen-addressオプションをつけて起動する必要があるため、一旦Prometheus serverを停止します。
$ ps -ef | grep prom

Prometheus serverのPIDを確認してkillする
$ sudo kill -15 <PID>
## Prometheus 1.8の起動
-web.listen-addressオプションをつけて起動します。
$ ./prometheus -web.listen-address ":9094" &
[1] 9380
$ INFO[0000] Starting prometheus (version=1.8.0, branch=HEAD, revision=3569eef8b1bc062bb5df43181b938277818f365b)  source="main.go:87"
INFO[0000] Build context (go=go1.9.1, user=root@bd4857492255, date=20171006-22:12:46)  source="main.go:88"
INFO[0000] Host details (Linux 3.10.0-693.el7.x86_64 #1 SMP Thu Jul 6 19:56:57 EDT 2017 x86_64 ip-10-0-0-39.ap-northeast-1.compute.internal (none))  source="main.go:89"
INFO[0000] Loading configuration file prometheus.yml     source="main.go:254"
INFO[0000] Listening on :9094                            source="web.go:341"
INFO[0000] Loading series map and head chunks...         source="storage.go:428"
INFO[0000] 563 series loaded.                            source="storage.go:439"
INFO[0000] Server is Ready to receive requests.          source="main.go:230"
INFO[0000] Starting target manager...                    source="targetmanager.go:63"
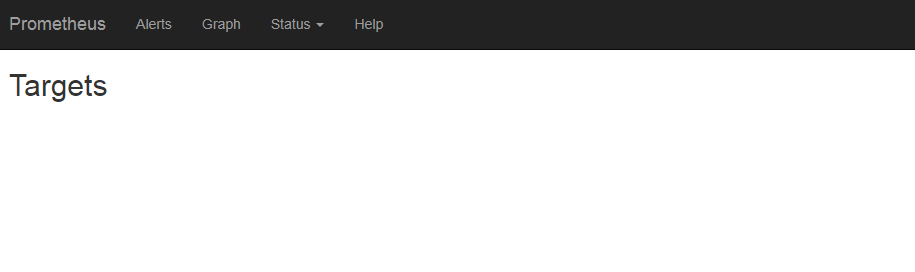
再起動後、http://localhost:9094にアクセスして、データ収集がされていないことを確認します。Targetの画面を確認すると真っ白でした。
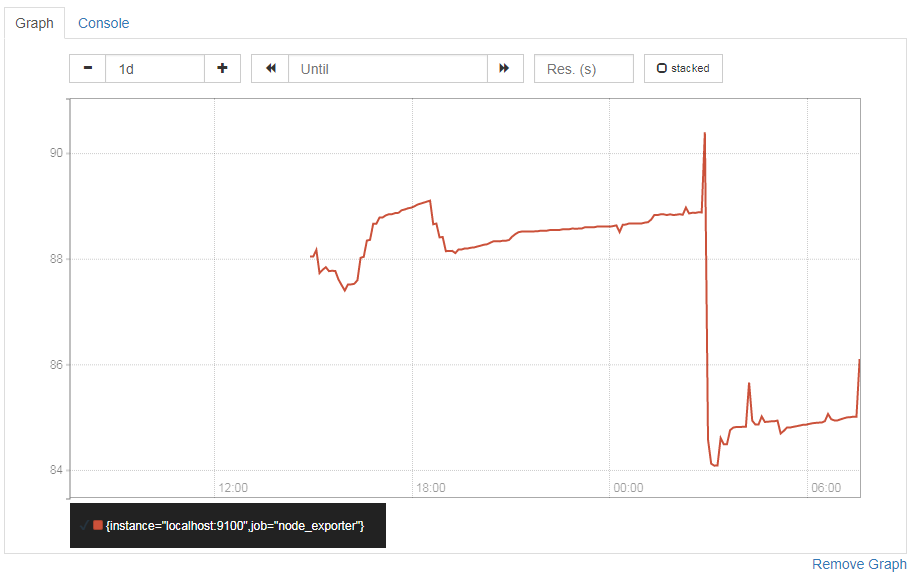
memory使用率の推移をグラフにしてみました。
メトリクスはこちらで
(node_memory_MemTotal - node_memory_MemFree )/node_memory_MemTotal * 100
結果が下のグラフです。とりあえず一日ほど動かしておいた状態。
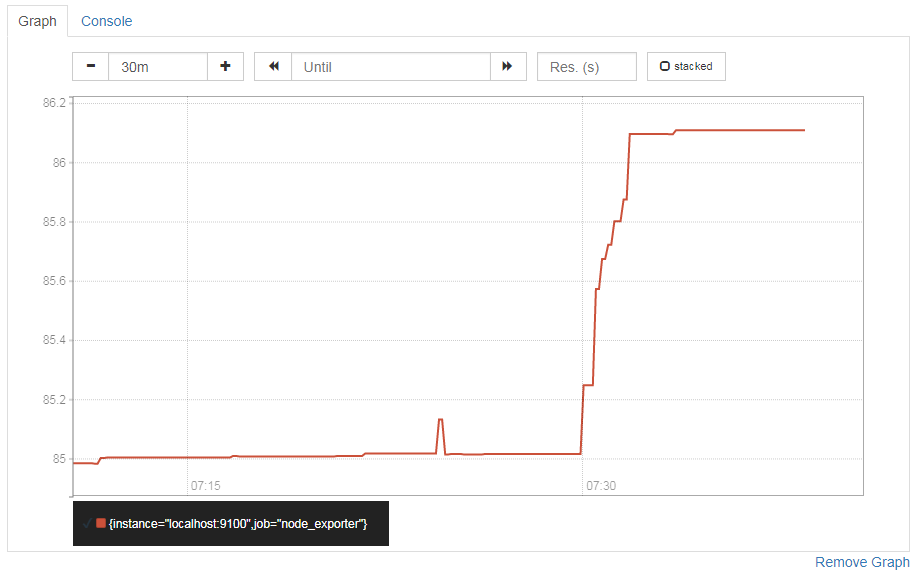
Prometheus server 1.8を一旦停止し、ノンスクレイピング状態で起動しなおしたので停止してからそれ以降はデータを収集していません。先ほどのグラフをズームするとこんな感じ。収集が止まりました。
次に、2.0を起動します。
# Prometheus 2.0の起動
Prometheus 1.8のconfig.fileを編集し、ノンスクレイピングな状態で起動するようにしました。
次にPrometheus 2.0を起動します。2.0用のconfig.fileはすでに作成済みなので、そのconfig.fileを読み込むようにPrometheus serverを起動します。
$ ./prometheus &
[2] 13685
$ level=info ts=2017-12-08T07:42:10.610696763Z caller=main.go:215 msg="Starting Prometheus" version="(version=2.0.0, branch=HEAD, revision=0a74f98628a0463dddc90528220c94de5032d1a0)"
level=info ts=2017-12-08T07:42:10.610750275Z caller=main.go:216 build_context="(go=go1.9.2, user=root@615b82cb36b6, date=20171108-07:11:59)"
level=info ts=2017-12-08T07:42:10.610766417Z caller=main.go:217 host_details="(Linux 3.10.0-693.el7.x86_64 #1 SMP Thu Jul 6 19:56:57 EDT 2017 x86_64 ip-10-0-0-39.ap-northeast-1.compute.internal (none))"
level=info ts=2017-12-08T07:42:10.613662234Z caller=web.go:380 component=web msg="Start listening for connections" address=0.0.0.0:9090
level=info ts=2017-12-08T07:42:10.61704377Z caller=main.go:314 msg="Starting TSDB"
level=info ts=2017-12-08T07:42:10.621430086Z caller=targetmanager.go:71 component="target manager" msg="Starting target manager..."
level=info ts=2017-12-08T07:42:10.621648506Z caller=main.go:326 msg="TSDB started"
level=info ts=2017-12-08T07:42:10.621667515Z caller=main.go:394 msg="Loading configuration file" filename=prometheus.yml
level=info ts=2017-12-08T07:42:10.622236515Z caller=main.go:371 msg="Server is ready to receive requests."
2.0を起動した後で、先ほどと同じメトリクスの値を確認してみます。先程のグラフと同じ結果が取れました。無事に、1.8で取得したデータを参照することができました。
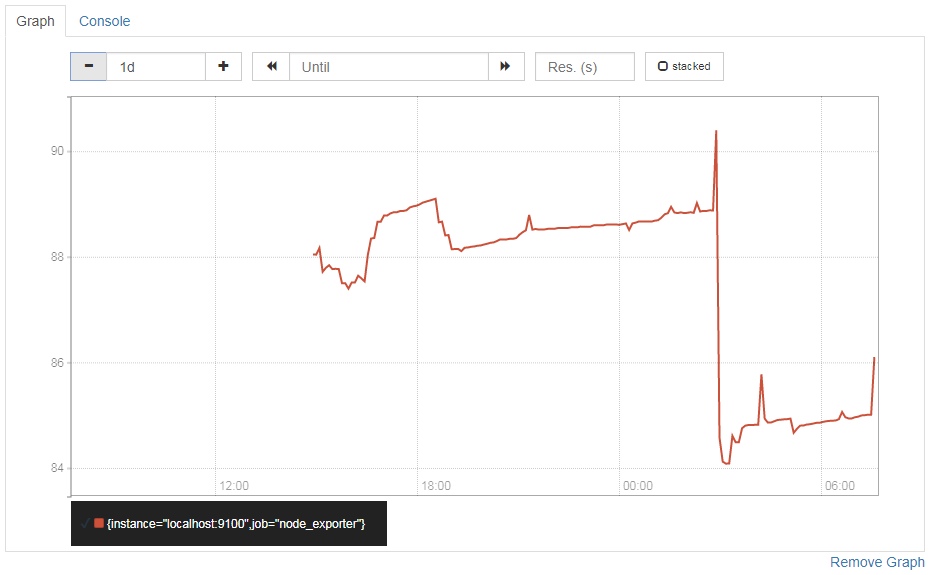
拡大するとこんな感じ。
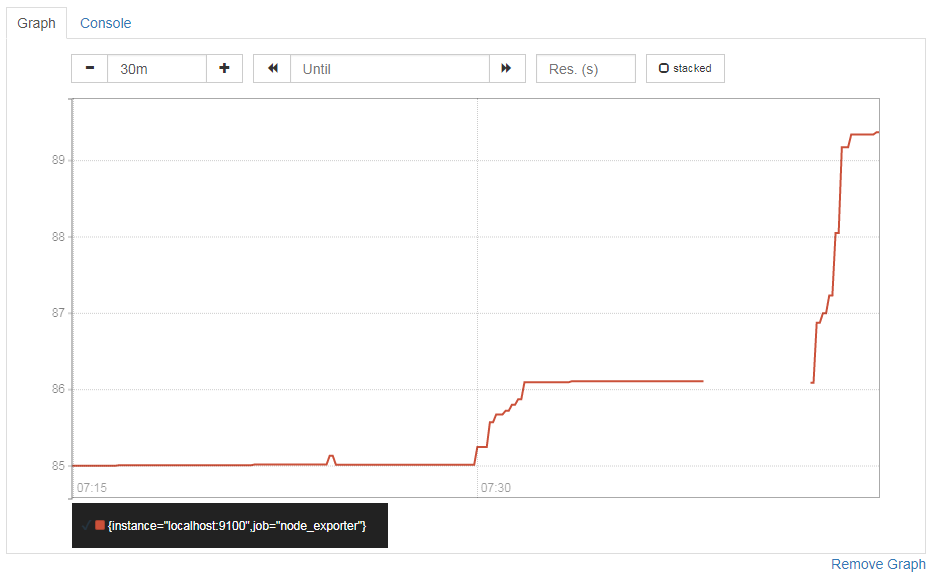
1.8停止後、2.0を起動するまでの間がきれています。
運用として1.8と2.0をいつまで並行稼働させるかですが、1.8が保管している過去データが2.0で設定しているretention期間をすぎてしまったら終わりかなと思います。2.0側で収集したデータの保持期間が終了しているのにそれより古い1.8のデータを参照できるようにしておいても仕方ないと思うので。
以上、簡単ですが、remote_read設定による1.8と2.0の並行稼働を検証してみました。