こんにちは、Qt Advent Calendar 2017の20日目の記事です。
このところ、仕事が忙しく、20日を過ぎてしまい、申し訳ありません…
はじめに
Qtには、Qt ChartsがあるのですがGPLライセンスのため、今回は使用を諦め、自前でグラフ機能を実装することにしました。
グラフの描画
今回は、QWidgetをサブクラス化してグラフ機能を実装してみました。また、グラフ表示する場合、テーブルでも、表示するケースが多いので、モデル/ビュー方式にしました。その場合QAbstractItemViewをサブクラス化する方がいいのかもしれませんが、グラフ上で編集することは想定していなかったので単純なQWidgetのサブクラス化とsetModel()を実装するようにしています。
テーブルデータの0列がX軸、1列以降がY軸データになります。
    ...
    m_model = new QStandardItemModel(0, 3, this);
    m_model->setHeaderData(0, Qt::Horizontal, tr("X Axis"));
    m_model->setHeaderData(1, Qt::Horizontal, tr("Plot 1"));
    m_model->setHeaderData(2, Qt::Horizontal, tr("Plot 2"));
    ...
グラフを書いてみる
グラフの生成
    // table
    ui->tableView->setModel(m_model);

    // Graph
    // モデルをセットすると、column 0が、X軸/column 1.. がY軸としてPlotが生成されます。
    ui->graph->setModel(m_model);

    // 軸の生成
    m_axis1 = new Axis(this);
    m_axis2 = new Axis(this);

    m_axis1->setLineColor(Qt::red);
    m_axis2->setLineColor(Qt::green);

    Plot* plot1 = ui->graph->plot(1); // column 1
    Plot* plot2 = ui->graph->plot(2); // column 2
    plot1->setLineColor(Qt::red);
    plot2->setLineColor(Qt::green);
    plot1->setLineWidth(1);
    plot2->setLineWidth(1);

    // プロットと軸の関連付け
    ui->graph->setPlot(plot1, m_axis1);
    ui->graph->setPlot(plot2, m_axis2);
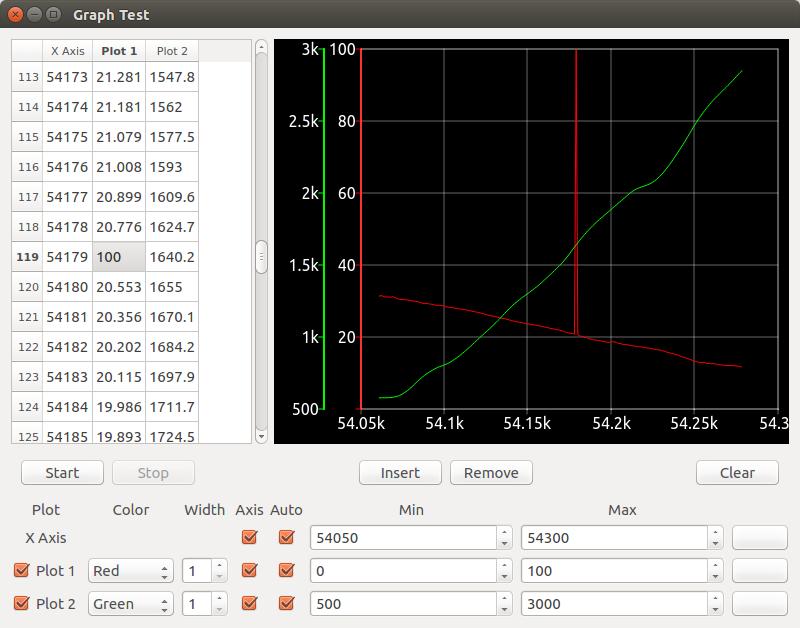
サンプルの説明
グラフのデータによって、適切な軸のスケールが表示されます。
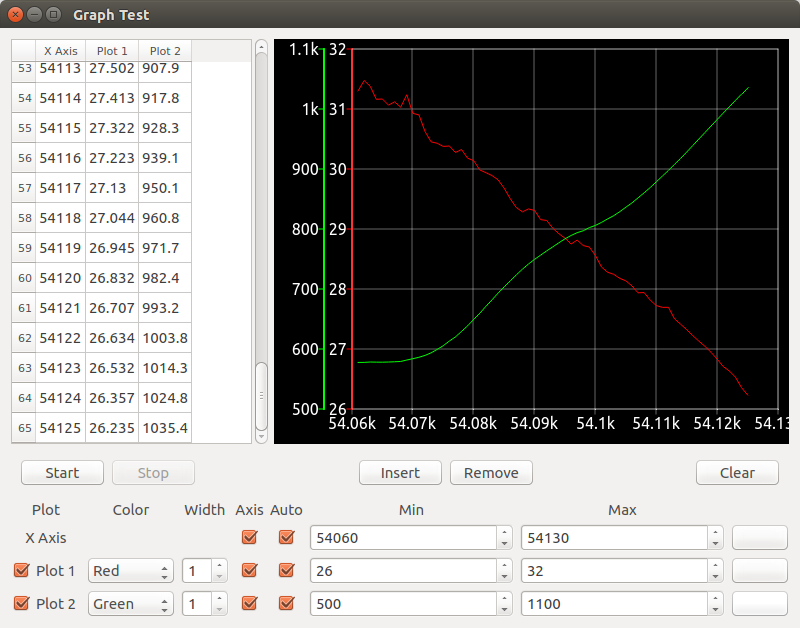
データを追加していくと、軸のスケールが変わっています。

試しに、テーブルデータを編集すると、グラフも変わります。
ソースコード
graph.h
# pragma once

# include <QMap>
# include <QPixmap>
# include <QVector>
# include <QWidget>
# include <QObject>
# include <QAbstractItemModel>

class Plot;
class Axis;
class Axes;

class Graph : public QWidget
{
    Q_OBJECT

public:
    Graph(QWidget *parent = 0);

    void setPlot(Plot* plot, Axis* yAxis);
    void setPlot(int column, Axis* yAxis);

    QMap<Axis*, Plot*>& plots();
    Plot* plot(int column) const { return m_plots.value(column, nullptr); }
    Axis* xAxis();

    // Model
    void setModel(QAbstractItemModel *model);
    void append(const QModelIndex &topLeft, const QModelIndex &bottomRight);

protected:
    void paintEvent(QPaintEvent *event);
    void resizeEvent(QResizeEvent *event);

private slots:
    void onRefresh();
    void onAutoScaleUpdate();
    void onDataUpdate();
    void onYAxesVisbleChange(bool visble);
    void onXAxesVisbleChange(bool visible);

    // Model
    void onDataChange(const QModelIndex &topLeft, const QModelIndex &bottomRight,
                      const QVector<int> &roles = QVector<int>());
    void onRowsInsert(const QModelIndex &parent, int first, int last);
    void onRowsAboutToBeRemove(const QModelIndex &parent, int first, int last);
    void onRowsRemove(const QModelIndex &parent, int first, int last);
    void onResetModel();

private:
    void refreshPixmap();
    void drawGrid(QPainter *painter);
    void drawCurves(QPainter *painter);

    enum { Margin = 10,
           TickMarksWidth = 5,
         };

    QMultiMap<Axis*, Plot*> m_plotMap;
    Axes* m_axes;
    QPixmap m_pixmap;
    int m_visbleYAxesCount;
    QRect m_rect;
    QAbstractItemModel *m_model;
    QMap<int, Plot*> m_plots;
};

class Plot : public QObject
{
    Q_OBJECT
    Q_DISABLE_COPY(Plot)

public:
    explicit Plot(int section, QAbstractItemModel *model = 0, QObject *parent = 0);
    virtual ~Plot(){}

    QPointF minData() const { return m_minData; }
    QPointF maxData() const { return m_maxData; }

    bool visble() const;
    void setVisble(bool visble);

    QColor lineColor() const;
    void setLineColor(const QColor &lineColor);

    qreal lineWidth() const;
    void setLineWidth(qreal lineWidth);

    int count() const { return m_model->rowCount(); }
    void clear();
    double yData(int index) const { return m_model->index(index, m_section).data().toDouble(); }
    double xData(int index) const { return m_model->index(index, 0).data().toDouble(); }

    inline int plottedPoint() const;
    inline void setPlottedPoint(int plottedCount);
    void clearPlottedPoint() {m_plottedCount = 0;}

    bool calculateMinMaxData(const QModelIndex &yIndex, const QModelIndex &xIndex = QModelIndex());
    void checkMinMaxDeleteData(const QModelIndex &yIndex, const QModelIndex &xIndex = QModelIndex());
    bool recalculateMinMaxAllData(bool isForce = false);

signals:
    void refreshed();
    void autoScaleUpdated();
    void dataUpdated();

private:
    int m_section;
    QAbstractItemModel *m_model;
    bool m_visble;
    QColor m_lineColor;
    qreal m_lineWidth;
    QPointF m_minData;
    QPointF m_maxData;
    int m_plottedCount;
    bool m_isRecalculateMinMax;
};

class Axis : public QObject
{
    Q_OBJECT
    Q_DISABLE_COPY(Axis)

public:
    explicit Axis(QObject* parent = 0);
    virtual ~Axis() {}

    bool visble() const;
    void setVisble(bool visble);

    qreal min() const;
    void setMin(qreal value);
    qreal max() const;
    void setMax(qreal value);
    bool autoScale() const;
    void setAutoScale(bool autoScale);

    QColor lineColor() const;
    void setLineColor(const QColor &lineColor);

    enum UpdateAdjust { AutoScale, Forced };

    void adjust(qreal min, qreal max,
                UpdateAdjust updateAdjust = AutoScale) {
        adjustAxis(min, max, updateAdjust);
    }
    bool autoScaleAdjustX(QList<Plot*> axes);
    bool autoScaleAdjustY(QList<Plot*> axes);

    int numTicks() const { return m_adjustSettings.numTicks; }
    qreal span() const { return m_adjustSettings.max - m_adjustSettings.min; }

    void clearMaxTickLabelWidth() { m_maxTickLabelWidth = 0; }
    void setMaxTickLabelWidth(int width) {
        if (m_maxTickLabelWidth < width)
            m_maxTickLabelWidth = width;
    }
    int maxTickLabelWidth() const { return m_maxTickLabelWidth; }

signals:
    void visbleChanged(bool visble);
    void autoScaleChanged(bool autoScale);
    void minMaxChanged();

private:
    bool adjustAxis(qreal min, qreal max, UpdateAdjust updateAdjust);

    struct AdjustSettings {
        qreal min;
        qreal max;
        int numTicks;
    } m_adjustSettings;

    bool m_visble;
    bool m_autoScale;
    QString m_caption;
    QColor m_lineColor;
    int m_maxTickLabelWidth;
};

class Axes
{

public:
    explicit Axes(QObject* parent = 0);
    explicit Axes(int numAxes, QObject* parent = 0);
    ~Axes();

    Axis* xAxis() { return  m_xAxis; }
    QVector<Axis* >& yAxes() { return m_yAxes; }
    Axis* yAxes(int key) { return m_yAxes[key]; }

private:
    Axis* m_xAxis;
    QVector<Axis* > m_yAxes;
};
graph.cpp
# include <QtGui>
# if QT_VERSION >= 0x050000
# include <QtWidgets>
# endif
# include <cmath>

# include "siPrefixes.h"
# include "graph.h"

using namespace std;

Graph::Graph(QWidget *parent)
    : QWidget(parent),
      m_visbleYAxesCount(1)
{
    setBackgroundRole(QPalette::Dark);
    setAutoFillBackground(true);
    setSizePolicy(QSizePolicy::Expanding, QSizePolicy::Expanding);

    this->disconnect();

    m_axes = new Axes(0, this);

    connect(xAxis(), &Axis::visbleChanged, this, &Graph::onXAxesVisbleChange);
    connect(xAxis(), &Axis::autoScaleChanged, this, &Graph::onAutoScaleUpdate);
    connect(xAxis(), &Axis::minMaxChanged, this, &Graph::onRefresh);
}

void Graph::setPlot(Plot* plot, Axis* yAxis)
{
    m_plotMap.insert(yAxis, plot);
    m_axes->yAxes().append(yAxis);

    // Plot
    connect(plot, &Plot::refreshed, this, &Graph::onRefresh);
    connect(plot, &Plot::autoScaleUpdated, this, &Graph::onAutoScaleUpdate);
    connect(plot, &Plot::dataUpdated, this, &Graph::onDataUpdate);

    // Y Axis
    connect(yAxis, &Axis::visbleChanged, this, &Graph::onYAxesVisbleChange);
    connect(yAxis, &Axis::autoScaleChanged, this, &Graph::onAutoScaleUpdate);
    connect(yAxis, &Axis::minMaxChanged, this, &Graph::onRefresh);

    m_visbleYAxesCount = 0;
    foreach (Axis* yAxis, m_axes->yAxes()) {
        if (yAxis->visble())
           m_visbleYAxesCount++;
    }

    refreshPixmap();
}

void Graph::setPlot(int column, Axis *yAxis)
{
    setPlot(plot(column), yAxis);
}

Axis *Graph::xAxis()
{
    return m_axes->xAxis();
}

void Graph::paintEvent(QPaintEvent * /* event */)
{
    QStylePainter painter(this);
    painter.drawPixmap(0, 0, m_pixmap);

    if (hasFocus()) {
        QStyleOptionFocusRect option;
        option.initFrom(this);
        option.backgroundColor = palette().dark().color();
        painter.drawPrimitive(QStyle::PE_FrameFocusRect, option);
    }
}

void Graph::resizeEvent(QResizeEvent * /* event */)
{
    refreshPixmap();
}

void Graph::onRefresh()
{
    refreshPixmap();
}

void Graph::onAutoScaleUpdate()
{
    bool updateGrid = false;
    Axis* xAxis = m_axes->xAxis();
    if (xAxis->autoScale()) {
        if (xAxis->autoScaleAdjustX(m_plotMap.values()))
            updateGrid = true;
    }

    foreach(Axis* yAxes, m_axes->yAxes()) {
        if (yAxes->autoScale()) {
            if (yAxes->autoScaleAdjustY(m_plotMap.values(yAxes)))
                updateGrid = true;
        }
    }

    if (updateGrid)
        onRefresh();
    else
        onDataUpdate();
}

void Graph::onDataUpdate()
{
    QPainter painter(&m_pixmap);
    drawCurves(&painter);
    update();
}

void Graph::onYAxesVisbleChange(bool visble)
{
    visble ? m_visbleYAxesCount++ : m_visbleYAxesCount--;
    refreshPixmap();
}

void Graph::onXAxesVisbleChange(bool /*visible*/)
{
    refreshPixmap();
}

void Graph::onDataChange(const QModelIndex &topLeft, const QModelIndex &bottomRight,
                         const QVector<int> &/*roles*/)
{
    for (int column = topLeft.column(); column <= bottomRight.column(); column++) {
        if (column != 0) { // Y Axis
            for (int row = topLeft.row(); row <= bottomRight.row(); row++) {
                m_plots.value(column)->recalculateMinMaxAllData(true);
            }
        }
    }

    onAutoScaleUpdate();
    onRefresh();
}

void Graph::onRowsInsert(const QModelIndex &parent, int first, int last)
{
    bool minmaxChange = false;
    bool isAppendMode = true;

    QMapIterator<int, Plot*> i(m_plots);
    while (i.hasNext()) {
        i.next();
        int column = i.key();
        if (column != 0) { // Y Axis
            if ((first +1) != i.value()->count())
                isAppendMode = false;

            for (int row = first; row <= last; row++) {
                QModelIndex yIndex = m_model->index(row, column, parent);
                QModelIndex xIndex = m_model->index(row, 0, parent);
                minmaxChange += i.value()->calculateMinMaxData(yIndex, xIndex);
            }
        }
    }

    if (isAppendMode) {
        if (minmaxChange)
            onAutoScaleUpdate();
        else
            onDataUpdate();
    }
    else {
        if (minmaxChange)
            onAutoScaleUpdate();
        onRefresh();
    }

}

void Graph::onRowsAboutToBeRemove(const QModelIndex &parent, int first, int last)
{
    QMapIterator<int, Plot*> i(m_plots);
    while (i.hasNext()) {
        i.next();
        int column = i.key();
        if (column != 0) { // Y Axis
            for (int row = first; row <= last; row++) {
                QModelIndex yIndex = m_model->index(row, column, parent);
                QModelIndex xIndex = m_model->index(row, 0, parent);
                i.value()->checkMinMaxDeleteData(yIndex, xIndex);
            }
        }
    }
}

void Graph::onRowsRemove(const QModelIndex &/*parent*/, int /*first*/, int /*last*/)
{
    bool minmaxChange = false;

    QMapIterator<int, Plot*> i(m_plots);
    while (i.hasNext()) {
        i.next();
        int column = i.key();
        if (column != 0) { // Y Axis
            minmaxChange +=i.value()->recalculateMinMaxAllData();
        }
    }

   if (minmaxChange)
       onAutoScaleUpdate();

    onRefresh();
}

void Graph::onResetModel()
{
    QMapIterator<int, Plot*> i(m_plots);
    while (i.hasNext()) {
        i.next();
        i.value()->clear();
    }

    onAutoScaleUpdate();
    onRefresh();
}

void Graph::refreshPixmap()
{
    m_pixmap = QPixmap(size());
    m_pixmap.fill(Qt::black);

    QPainter painter(&m_pixmap);
    painter.initFrom(this);
    painter.setRenderHint(QPainter::Antialiasing, true);
    drawGrid(&painter);
    drawCurves(&painter);
    update();
}

void Graph::drawGrid(QPainter *painter)
{
    QFontMetrics fm(font());

    QVector<QString> labels;
    SiPrefixes siLabel;
    int yAxisMargin = 0;
    foreach (Axis* yAxis, m_axes->yAxes()) {
        yAxis->clearMaxTickLabelWidth();
        if (yAxis->visble()) {
            for (int j = 0; j <= yAxis->numTicks(); ++j) {
                double labelVal = yAxis->min() + (j * yAxis->span() / yAxis->numTicks());
                siLabel.setValue(labelVal);
                labels.append(siLabel.text());
                yAxis->setMaxTickLabelWidth(fm.width(siLabel.text()) + TickMarksWidth +5);
            }
            yAxisMargin += yAxis->maxTickLabelWidth();
        }
    }

    QRect rect(yAxisMargin + Margin,
               Margin,
               width() - (yAxisMargin + ( 2 * Margin)),
               height() - (TickMarksWidth + (xAxis()->visble() * fm.height()) + (2 * Margin)));
    m_rect = rect;

    if (!rect.isValid())
        return;


    QPen quiteDark = QPen(palette().dark().color().light(), 1, Qt::DotLine);
    QPen light = QPen(palette().light().color(), 0.4);

    if (m_axes->xAxis()->visble()) {
        int previousTextXEndPoint = numeric_limits<int>::min();
        for (int i = 0; i <= m_axes->xAxis()->numTicks(); ++i) {
            int x = rect.left() + (i * (rect.width() - 1) / m_axes->xAxis()->numTicks());
            double labelVal = m_axes->xAxis()->min() + (i * m_axes->xAxis()->span() / m_axes->xAxis()->numTicks());
            siLabel.setValue(labelVal);
            int textWidth = fm.width(siLabel.text());
            int textXPoint = x - textWidth/2;

            // X Ticks
            painter->setPen(light);
            painter->drawLine(x, rect.top(), x, rect.bottom());
            painter->drawLine(x, rect.bottom(), x, rect.bottom());

            if (previousTextXEndPoint < textXPoint) { // ラベルが重なる場合は表示しない
                // X Ticks
                painter->drawLine(x, rect.bottom(), x, rect.bottom());
                painter->drawLine(x, rect.bottom(), x, rect.bottom() + TickMarksWidth);

                // X Label
                painter->drawText(textXPoint,
                                  rect.bottom() + TickMarksWidth,
                                  textWidth,
                                  fm.height(),
                                  Qt::AlignTop,
                                  siLabel.text());
                previousTextXEndPoint = x + textWidth/2 + 5;
            }
        }
    }

    int yAxesNum = 0;
    int yAxisLabelsOffset = 0;
    int yAxisTicksOffset = 0;
    foreach (const Axis* yAxis, m_axes->yAxes()) {
        if (yAxis->visble()) {
            int previousTextYTopPoint = numeric_limits<int>::max();
            yAxisLabelsOffset += yAxis->maxTickLabelWidth();
            for (int j = 0; j <= yAxis->numTicks(); ++j) {
                int y = rect.bottom() - (j * (rect.height() - 1) / yAxis->numTicks());

                if (yAxesNum == 0) { // first
                    // Grid Line
                    painter->setPen(light);
                    painter->drawLine(rect.left(), y, rect.right(), y);
                }

                // Ticks
                QPen pen(yAxis->lineColor(), 1.0);
                painter->setPen(pen);
                painter->drawLine(rect.left() - yAxisTicksOffset - TickMarksWidth, y,
                                  rect.left() - yAxisTicksOffset, y);
                painter->drawLine(rect.left() - yAxisTicksOffset, rect.top(),
                                  rect.left() - yAxisTicksOffset, rect.bottom());

                // Label
                painter->setPen(light);
                QString label = labels.takeFirst();
                if ((y + fm.height()/2) < previousTextYTopPoint) {
                    int textYPoint = y - fm.height()/2;
                    painter->drawText(rect.left() - yAxisLabelsOffset,
                                      textYPoint,
                                      yAxis->maxTickLabelWidth() - TickMarksWidth,
                                      fm.height(),
                                      Qt::AlignRight,
                                      label);
                    previousTextYTopPoint = textYPoint;
                }
            }
            yAxisTicksOffset = yAxisLabelsOffset;
            yAxesNum++;
        }
    }
    painter->drawRect(rect.adjusted(0, 0, -1, -1));

    QMapIterator<Axis*, Plot*> i(m_plotMap);
    while (i.hasNext()) {
        i.next();
        Plot* plot = i.value();
        plot->clearPlottedPoint();
    }

}

void Graph::drawCurves(QPainter *painter)
{
    if (!m_rect.isValid())
        return;

    painter->setClipRect(m_rect.adjusted(+1, +1, -1, -1));

    QMapIterator<Axis*, Plot*> i(m_plotMap);
    while (i.hasNext()) {
        i.next();

        Plot* plot = i.value();
        if (plot->visble()) {
            Axis* yAxis = i.key();
            int plotEndPoint = plot->count();
            QPolygonF polyline(plotEndPoint - plot->plottedPoint());

            int n = 0;
            for (int j = plot->plottedPoint(); j < plotEndPoint; ++j) {
                double dx = plot->xData(j) - m_axes->xAxis()->min();
                double dy = plot->yData(j) - yAxis->min();
                double x = m_rect.left() + (dx * (m_rect.width() - 1)
                                          / m_axes->xAxis()->span());
                double y = m_rect.bottom() - (dy * (m_rect.height() - 1)
                                            / yAxis->span());
                polyline[n++] = QPointF(x, y);
            }
            plot->setPlottedPoint(plotEndPoint-1);


            QPen pen(plot->lineColor(), plot->lineWidth());
            painter->setPen(pen);
            painter->drawPolyline(polyline);
        }
    }
}

QMap<Axis*, Plot*> &Graph::plots()
{
    return m_plotMap;
}

void Graph::setModel(QAbstractItemModel *model)
{
    m_plots.clear();
    if (model) {
        int section = 1;
        QVariant header;
        do {
            header = model->headerData(section, Qt::Horizontal);
            if (header.toString().size()) {
                m_plots.insert(section, new Plot(section, model, this));
            }
            section++;

        } while(header.toString().size());
    }
    m_model = model;

    connect(model, &QAbstractItemModel::modelReset, this, &Graph::onResetModel);
    connect(model, &QAbstractItemModel::rowsInserted, this, &Graph::onRowsInsert);
    connect(model, &QAbstractItemModel::rowsAboutToBeRemoved, this, &Graph::onRowsAboutToBeRemove);
    connect(model, &QAbstractItemModel::rowsRemoved, this, &Graph::onRowsRemove);
    connect(model, &QAbstractItemModel::dataChanged, this, &Graph::onDataChange);
}

void Graph::append(const QModelIndex &topLeft, const QModelIndex &bottomRight)
{
    bool minmaxChange = false;
    for (int column = topLeft.column(); column <= bottomRight.column(); column++) {
        if (column != 0) { // Y Axis
            for (int row = topLeft.row(); row <= bottomRight.row(); row++) {
                QModelIndex yIndex = m_model->index(row, column);
                QModelIndex xIndex = m_model->index(row, 0);
                minmaxChange += m_plots.value(column)->calculateMinMaxData(yIndex, xIndex);
            }
        }
    }

   if (minmaxChange)
       emit m_plots.value(bottomRight.column())->autoScaleUpdated();
   else
       emit m_plots.value(bottomRight.column())->dataUpdated();
}


Axes::Axes(QObject* parent)
{
    m_xAxis = new Axis(parent);
    m_yAxes.insert(0, new Axis(parent));
}

Axes::Axes(int numAxes, QObject* parent)
{
    m_xAxis = new Axis(parent);
    for (int n = 0; n < numAxes; n++)
        m_yAxes.append(new Axis(parent));
}

Axes::~Axes()
{
}


Axis::Axis(QObject *parent)
    : QObject(parent),
      m_adjustSettings({0.0, 10.0, 5}),
      m_visble(true),
      m_autoScale(true),
      m_caption(QString()),
      m_lineColor(Qt::white),
      m_maxTickLabelWidth(0)
{
}

bool Axis::autoScaleAdjustX(QList<Plot *> axes)
{
    qreal min = numeric_limits<qreal>::max();
    qreal max = numeric_limits<qreal>::min();

    foreach (Plot* plot, axes) {
        if (min > plot->minData().x())
            min = plot->minData().x();
        if (max < plot->maxData().x())
            max = plot->maxData().x();
    }

    return adjustAxis(min, max, AutoScale);
}

bool Axis::autoScaleAdjustY(QList<Plot *> axes)
{
    qreal min = numeric_limits<qreal>::max();
    qreal max = numeric_limits<qreal>::min();

    foreach (Plot* plot, axes) {
        if (min > plot->minData().y())
            min = plot->minData().y();
        if (max < plot->maxData().y())
            max = plot->maxData().y();
    }

    return adjustAxis(min, max, AutoScale);
}


bool Axis::adjustAxis(qreal min, qreal max, UpdateAdjust updateAdjust)
{
    bool updateGrid = false;
    if (updateAdjust == Forced || m_autoScale) {
        const int MinTicks = 4;
        qreal grossStep = (max - min) / MinTicks;
        qreal step = pow(10.0, floor(log10(grossStep)));

        if (qIsNaN(step) || step == 0.0)
            return false;

        if ((5 * step) < grossStep)
            step *= 5;
        else if ((2 * step) < grossStep)
            step *= 2;

        m_adjustSettings.numTicks = int(ceil(max / step) - floor(min / step));
        if (m_adjustSettings.numTicks < MinTicks)
            m_adjustSettings.numTicks = MinTicks;
        min = floor(min / step) * step;
        max = ceil(max / step) * step;

        if (m_adjustSettings.min != min ||
                m_adjustSettings.max != max) {
            updateGrid = true;

            m_adjustSettings.min = min;
            m_adjustSettings.max = max;
        }
    }

    return updateGrid;
}

bool Axis::autoScale() const
{
    return m_autoScale;
}

void Axis::setAutoScale(bool autoScale)
{
    if (m_autoScale != autoScale) {
        m_autoScale = autoScale;

        emit autoScaleChanged(autoScale);
    }
}

QColor Axis::lineColor() const
{
    return m_lineColor;
}

void Axis::setLineColor(const QColor &lineColor)
{
    if (m_lineColor != lineColor) {
        m_lineColor = lineColor;
        emit minMaxChanged();
    }
}

bool Axis::visble() const
{
    return m_visble;
}

void Axis::setVisble(bool visble)
{
    if (m_visble != visble) {
        m_visble = visble;

        emit visbleChanged(visble);
    }
}

qreal Axis::min() const
{
    return m_adjustSettings.min;
}

void Axis::setMin(qreal value)
{
    if (m_adjustSettings.min != value && !m_autoScale) {
        if (adjustAxis(value, m_adjustSettings.max, Forced))
            emit minMaxChanged();
    }
}

qreal Axis::max() const
{
    return m_adjustSettings.max;
}

void Axis::setMax(qreal value)
{
    if (m_adjustSettings.max != value && !m_autoScale) {
        if (adjustAxis(m_adjustSettings.min, value, Forced))
            emit minMaxChanged();
    }
}


Plot::Plot(int section, QAbstractItemModel *model, QObject *parent)
    : QObject(parent),
      m_section(section),
      m_model(model),
      m_visble(true),
      m_lineColor(Qt::red),
      m_lineWidth(1.0),
      m_minData(numeric_limits<qreal>::max(), numeric_limits<qreal>::max()),
      m_maxData(numeric_limits<qreal>::min(), numeric_limits<qreal>::min()),
      m_plottedCount(0),
      m_isRecalculateMinMax(false)
{
}

bool Plot::calculateMinMaxData(const QModelIndex &yIndex, const QModelIndex &xIndex)
{
    bool minmaxChange = false;

    // X Axis
    double xData = xIndex.data().toDouble();
    if (m_maxData.x() < xData) {
        m_maxData.setX(xData);
        minmaxChange = true;
    }
    if (m_minData.x() > xData) {
        m_minData.setX(xData);
        minmaxChange = true;
    }
    // Y Axis
    double yData = yIndex.data().toDouble();
    if (m_maxData.y() < yData) {
        m_maxData.setY(yData);
        minmaxChange = true;
    }
    if (m_minData.y() > yData) {
        m_minData.setY(yData);
        minmaxChange = true;
    }

    return minmaxChange;
}

void Plot::checkMinMaxDeleteData(const QModelIndex &yIndex, const QModelIndex &xIndex)
{
   bool recalculateX = true;
   bool recalculateY = true;

    // X Axis
    double xData = xIndex.data().toDouble();
    if (m_minData.x() < xData && xData < m_maxData.x()) {
        recalculateX = false;
    }

    // Y Axis
    double yData = yIndex.data().toDouble();
    if (m_minData.y() < yData && yData < m_maxData.y()) {
        recalculateY = false;
    }

    m_isRecalculateMinMax = (recalculateX || recalculateY);
}

bool Plot::recalculateMinMaxAllData(bool isForce)
{
    if (m_isRecalculateMinMax || isForce) {
        clear();
        double data;
        for (int row = 0; row < count(); row++) {
            // Y Axis
            data = m_model->index(row, m_section).data().toDouble();
            if (m_maxData.y() < data)
                m_maxData.setY(data);
            if (m_minData.y() > data)
                m_minData.setY(data);

            // X Axis
            data = m_model->index(row, 0).data().toDouble();
            if (m_maxData.x() < data)
                m_maxData.setX(data);
            if (m_minData.x() > data)
                m_minData.setX(data);
        }
        m_isRecalculateMinMax = false;
        return true;
    }

    return false;
}

bool Plot::visble() const
{
    return m_visble;
}

void Plot::setVisble(bool visble)
{
    if (m_visble != visble) {
        m_visble = visble;
        emit refreshed();
    }
}

QColor Plot::lineColor() const
{
    return m_lineColor;
}

void Plot::setLineColor(const QColor &lineColor)
{
    if (m_lineColor != lineColor) {
        m_lineColor = lineColor;
        emit refreshed();
    }
}

qreal Plot::lineWidth() const
{
    return m_lineWidth;
}

void Plot::setLineWidth(qreal lineWidth)
{
    if (m_lineWidth != lineWidth) {
        m_lineWidth = lineWidth;
        emit refreshed();
    }
}

void Plot::clear()
{
    m_plottedCount = 0;
    m_minData.setX(numeric_limits<double>::max());
    m_minData.setY(numeric_limits<double>::max());
    m_maxData.setX(numeric_limits<double>::min());
    m_maxData.setY(numeric_limits<double>::min());
}

int Plot::plottedPoint() const
{
    return m_plottedCount;
}

void Plot::setPlottedPoint(int plottedCount)
{
    if (plottedCount < 0)
        m_plottedCount = 0;
    else
        m_plottedCount = plottedCount;
}
まとめ
時間なく、かなり手抜きに記事になってしまった…
ソースコードはGitHubにあげる予定です。
ツッコミどころ多くてすいません。