gnuplotで立体図形の描画
 xyz座標軸に立体を配置したく, ある程度扱えるgnuplotを用いた. 他のソフトウェアの方がもっと見栄え良くできるかもしれないが, 個人的にはgnuplotでのクオリティに満足はしたので, 投稿をすることにした.
作り方
ターミナル上でgnuplotを起動するには, 一般的に
gnuplot
と入力をすると思われるが, 今回は等比率で描画したいので,
gnuplot -geometry 480x480
としてgnuplotを起動する. そして, コードを記述したtxtファイルを用意して
load "plot.txt"
と読み込んで, 実行してあげれば良い. plot.txtの中身は
set ticslevel 0 #z軸方向に詰める
unset key #反例をなくす
set grid #罫線を描画
set xlabel "X axis" #軸名の設定
set ylabel "Y axis"
set zlabel "Z axis"
splot "data.txt" using 1:2:3 w l lt rgb "black" lw 2
replot "data2.txt" using 1:2:3 w l lw 2
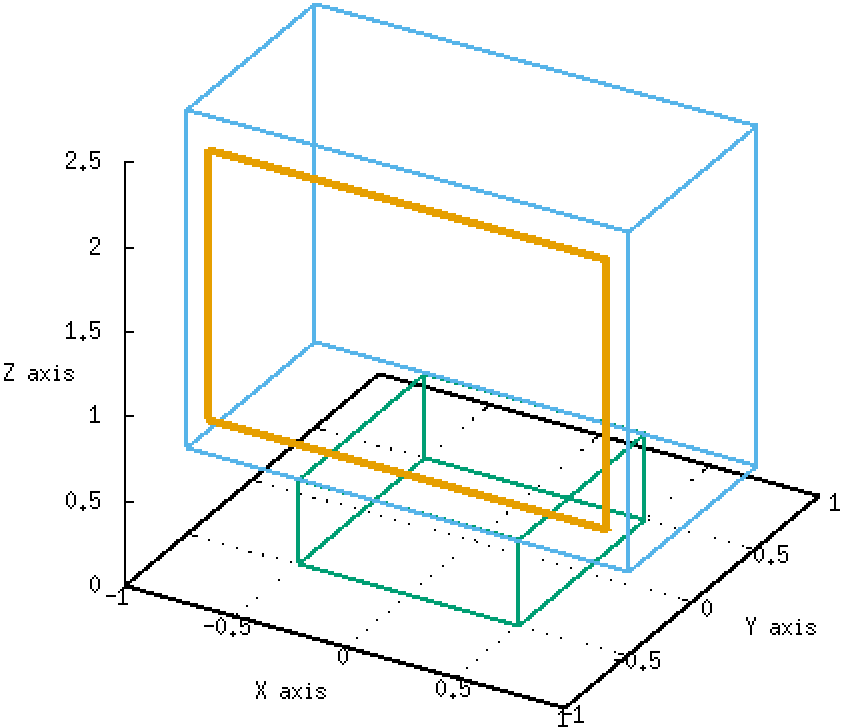
replot "data3.txt" using 1:2:3 w l lw 2 #冒頭の図の青色部分の直方体の描画
replot "data4.txt" using 1:2:3 w l lw 4
とした. dataには描画したい立方体の頂点を入力していけば良い. 例えば, 冒頭の図の青色の立方体の場合は, data3.txtに頂点情報が入っており, その中身は以下である. 図形は閉じて欲しいので, 最初と最後の頂点情報は等しくしてあげることには注意が必要である.
 1.0 -0.5 0.5  #ここと
 1.0  0.5 0.5
-1.0  0.5 0.5
-1.0 -0.5 0.5
 1.0 -0.5 0.5  #ここは一致させる

 1.0 -0.5 2.5  #ここと
 1.0  0.5 2.5
-1.0  0.5 2.5
-1.0 -0.5 2.5
 1.0 -0.5 2.5  #ここも同じく一致させる