はじめに
各リーグの勝敗結果およびSiegeGGのスタッツをもとにSix Sweden Majorの勝敗を予想しました。
最近ディープラーニングについて勉強を始めたのでその復習を主な目的としています。
ほとんどは『ゼロから作るDeepLearning』から得た知識になります。
マップやチーム相性、BO1or3の区別等もまったくついておらず完全に数値上での予想になりますがご了承ください。
データの準備
APAC, NA, EU, BR各リーグのチームごとのスタッツ及び結果を一つのスプレッドシートにまとめて学習データとしました。
APACはNorthとSouthの結果をまとめるのが大変そうだったので甘えてPlayoffの結果をまとめました。
https://docs.google.com/spreadsheets/d/1NnUghQ0OOZPMg07-ZWZmHngOpjavmzHOtN2cdrm7k-w/edit?usp=sharing
team stats
各チームのスタッツになります。主に平均をとっています。
KD、Entryは総数/総数みたいに計算をしています。
results
それぞれ左のチームのスタッツ/右のチームのスタッツとして計算しています。
右チームが勝利した場合はresultが1、敗北した場合は0としています。
同じマッチアップでも左右入れ替えることでデータの水増しを試みています。
test
resultsからresultを抜いただけのものです。
Six Sweden Majorで行われる予定のマッチアップを入れています。
関数の準備
今回はディープラーニングの基礎の復習も行いたいのでなるべくライブラリには頼らずに実装していきます。
- 活性化関数はシグモイド関数
- 出力層でも0~1の値で予想したいためシグモイド関数を使用する
- 損失関数は交差エントロピー
- 多クラス分類と同じものを実装する
import numpy as np

def sidmoid(x): #シグモイド関数
    return 1 / (1 + np.exp(-x))

def cross_entropy_error(y, t): #交差エントロピー
    if y.ndim == 1:
        t = t.reshape(1, t.size)
        y = y.reshape(1, y.size)

    batch_size = y.shape[0]
    return -np.sum(t * np.log(y + 1e-7)) / batch_size #1e-7を足すことでlog(0)になることを防ぐ
- 初期化
- ランダムに初期値を用意する
- 今回は入力層:7、隠れ層:30、出力層:1(sigmoid関数により0~1の間の1つの値が出力される。0.5未満で敗北、0.5以上で勝利)
# 重みの初期化

input_size = 7
hidden_size = 30
output_size = 1
weight_init_std = 0.01

params = {}
params["W1"] = weight_init_std * np.random.randn(input_size, hidden_size)
params["b1"] = np.zeros(hidden_size)
params["W2"] = weight_init_std * np.random.randn(hidden_size, output_size)
params["b2"] = np.zeros(output_size)
- predict
- 入力されたデータから推論を行う
- loss関数に渡すためここで0,1への変換は行わない
- loss
- 交差エントロピー誤差を求める
- accuracy
- 推論された結果を0,1に変換してから一致率を求める
def predict(x):
    W1, W2 = params["W1"], params["W2"]
    b1, b2 = params["b1"], params["b2"]

    a1 = np.dot(x, W1) + b1
    z1 = sigmoid(a1)
    a2 = np.dot(z1, W2) + b2
    y = sigmoid(a2)

    return y

def loss(x, t):
    y = predict(x)

    return cross_entropy_error(y, t)

def accuracy(x, t):
    y = predict(x)

    for i in range(y.size):
    if y[i] >= 0.5:
        y[i] = 1
    else:
        y[i] = 0

    y = np.argmax(y, axis=1)
    t = np.argmax(t)

    accuracy = np.sum(y==t) / float(x.shape[0])
    return accuracy
- 勾配
- 中心差分を用いて疑似的な微分を実装する
def numerical_grad(f, x): #勾配を求める
    h = 1e-04
    grad = np.zeros_like(x)

    for i in range(x.shape[0]):
        tmp = x[i]

        x[i] = tmp + h
        fxh1 = f(x)

        x[i] = tmp - h
        fxh2 = f(x)

        grad[i] = (fxh1 - fxh2) / (2*h)
        x[i] = tmp

    return grad

def numerical_grads(x, t):
    loss_W = lambda W: loss(x,t)

    grads = {}
    grads["W1"] = numerical_grad(loss_W, params["W1"])
    grads["b1"] = numerical_grad(loss_W, params["b1"])
    grads["W2"] = numerical_grad(loss_W, params["W2"])
    grads["b2"] = numerical_grad(loss_W, params["b2"])

    return grads
ニューラルネットワークの実装
ここまで用意した関数を用いて実際にNNを実装していきます。
splitしたデータでハイパーパラメータをチューニングしたりしましたが、そこは割愛します。
import pandas as pd

train = pd.read_csv("./swedenmajor_train.csv")
test = pd.read_csv("./swedenmajor_test.csv")

train_x = train[["rainting", "kd", "entry", "kost", "kpr", "srv", "1vx"]].values
train_t = train["result"].values
test_x = test[["rainting", "kd", "entry", "kost", "kpr", "srv", "1vx"]].values

train_size = train_x.shape[0]
epoch = 100
learning_rate = 0.1

for i in range(train_size * epoch): #このfor分の中でparamが更新されていく

    grads = numerical_grads(train_x, train_t)

    for key in ("W1", "b1", "W2", "b2"):
        params[key] -= learning_rate * grads[key]

test_y = predict(test_x) #更新されたparamを使って推論

for i in range(test_y.size): #0,1の形に直して勝敗がわかる形に
    if test_y[i] >= 0.5:
        test_y[i] = 1
    else:
        test_y[i] = 0
とても基礎的な知識のみではありますが、うまく実装することができました。
比較のためにサポートベクタマシンでも予測してみます。
SVMの実装
from sklearn.model_selection import train_test_split
from sklearn.svm import SVC

model = SVC(gamma='scale')
model.fit(train_x, train_t)

Y_pred = model.predict(test_x)
結果の比較
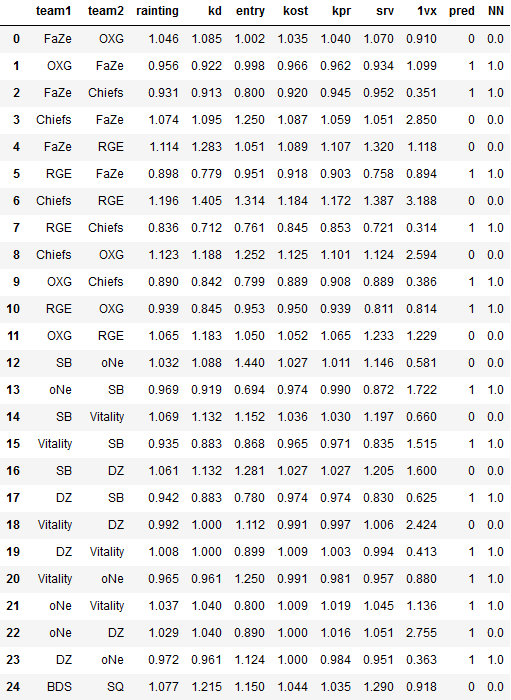
2つの方法で勝敗を予測したので結果を見比べてみます。
どちらがより良い結果になるかはDay3が終わるまでわかりませんね。
test["pred"] = Y_pred
test["NN"] = test_y
test


