最近、統計検定2級の受験のために、統計学を勉強し始めました。
ここではpythonで自分の原神祈願データを分析してみます。
ソースとデータは下記のgithub倉庫に公開しています。
https://github.com/Colincon2020/paimon_statistic
データの準備
先ずは、データ読み込みです。
import json
import math
from scipy import stats
from matplotlib import pyplot as plt
import matplotlib

matplotlib.rcParams['font.sans-serif']=['MS Gothic'] #日本語表示ためのフォント指定
matplotlib.rcParams['axes.unicode_minus']=False

with open('paimon-moe-local-data.json','r') as f:
    json_file = json.load(f)
次は自分が当たった星5の英字名前のリストを作成します。
characters_5star_list = [
    "mona",
    "kamisato_ayaka",
    "qiqi",
    "raiden_shogun",
    "jean",
    "albedo",
    "shenhe",
    "zhongli",
    "yae_miko"]
次に必要な情報を算出します。
characters_5star_wish_count = 0 #星5の合計
wish_count = 580 + 171 #祈願合計数
one_time_count_list = [] #星5が当たるまでの祈願回数収納リスト
one_time_count = 0 #星5が当たるまでの祈願回数
data = json_file.get("wish-counter-character-event")["pulls"]
for i in data:
    one_time_count += 1
    if i["id"] in characters_5star_list:
        characters_5star_wish_count += 1
        one_time_count_list.append(one_time_count)
        one_time_count = 0
data2 = json_file.get("wish-counter-standard")["pulls"]
one_time_count = 0
for i2 in data2:
    one_time_count += 1
    if i2["id"] in characters_5star_list:
        characters_5star_wish_count += 1
        one_time_count_list.append(one_time_count)
        one_time_count = 0
ここから本番の分析が始まります。
星5が当たるまでに何回ぐらい引けばいいという事に気になるので、星5が当たるまでの引き回数を分析します。
確率分布の選択
星5が当たるまでの引き回数を分析することは即ち、初めて成功するまで繰り返した試行回数の確率分布の分析なので、確率分布の選択は幾何分布にします。
幾何分布とは:
成功の確率が$p$であるベルヌーイ試行を、初めて成功するまで繰り返した試行回数$X$の確率分布は幾何分布です。
確率分布の期待値・分散・標準偏差・確率の算出:
統計学四天王を算出します。
- 期待値:
$E[X]=\frac{1}{p}$ - 分散:
$V[X]=\frac{1-p}{p^2}$ - 標準偏差:
$\sigma=\sqrt{V[X]}$ - 確率:
$p=\frac{星5獲得数}{引いた総回数}$
print("確率分布:幾何分布")
print("星5獲得回数: {:.2f}".format(characters_5star_wish_count))
p1 = characters_5star_wish_count/wish_count
print("星5の確率: {:.6f}".format(p1))
print("星5の期待値: {:.6f}".format(1/p1))
print("分散: {:.6f}".format((1-p1)/(p1*p1)))
print("標準偏差: {:.6f}".format(math.sqrt((1-p1)/(p1*p1))))
print("星5が当たるまでの回数リスト:",one_time_count_list)
確率分布:幾何分布
星5獲得回数: 12.00
星5の確率: 0.015979
星5の期待値: 62.583333
分散: 3854.090278
標準偏差: 62.081320
星5が当たるまでの回数リスト: [24, 80, 19, 64, 2, 81, 81, 82, 77, 67, 60, 49]
もちろん、優雅なるpythonerにはこんな煩雑なコードをお勧めしません。
優雅なるscipyを使います。
mean,variance,skewness,kurtosis=stats.geom.stats(p1,moments="mvsk")
print("E[X]:",mean)
print("V[X]:",variance)
print("標準偏差:",math.sqrt(variance))
print("歪度:",skewness)
print("尖度:",kurtosis)
E[X]: 62.583333333333336
V[X]: 3854.090277777778
標準偏差: 62.08131987786486
歪度: 2.00006486509863
尖度: 6.000259464602001
可視化
- 散布図
x = one_time_count_list
y = range(1,len(one_time_count_list)+1)
plt.scatter(y,x,alpha=0.6)
plt.plot(y,x)
plt.grid(axis='both')
plt.title("星5が当たるまでの回数")
plt.show()

- 箱ひげ図
plt.boxplot(x)
plt.title("星5が当たるまでの回数")
plt.show()

- 累積分布関数
n=wish_count
p=p1
x=range(0,wish_count)
pmf_result=stats.geom.cdf(x,p)

plt.bar(x,pmf_result)
plt.title("累積分布関数")
plt.grid(axis='both')
plt.show()

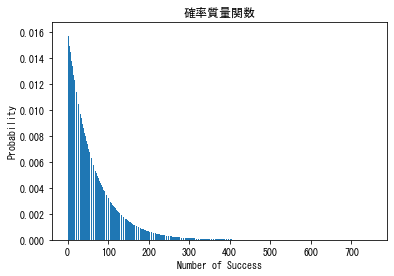
- 確率質量関数
n=wish_count
p=p1
x=range(0,n)
pmf_result=stats.geom.pmf(x,p)

plt.bar(x,pmf_result)
plt.xlabel('Number of Success')
plt.ylabel('Probability')
plt.title("確率質量関数")
plt.show()
統計推定・検定
ここの母数区間推定は星5の確率に興味があるので、原神祈願データで母集団の比率(即ち星5が当たる確率)の区間推定と母比率仮設検定を行います。
母数の区間推定
-
母比率区間推定公式:
$\hat{p}-z_{\alpha/2}\sqrt{\frac{\hat{p}(1-\hat{p})}{n}}\leq p \leq \hat{p}+z_{\alpha/2}\sqrt{\frac{\hat{p}(1-\hat{p})}{n}}$ -
有意水準:5%
z = 1.96 #標準正規分布の95%信頼区間のz値
p1_standard_error = z * (math.sqrt((p1*(1-p1))/wish_count))
print("標準誤差:{:.6f}".format(p1_standard_error))
print("母集団確率範囲:[{:.6f},{:.6f}]".format(p1 + p1_standard_error,p1 - p1_standard_error))
標準誤差:0.008968
母集団確率範囲:[0.024947,0.007010]
仮設検定
原神の公式では星5の総合確率は1.6%なので、母集団比率を0.016にします。
- 母比率検定公式:
$z=\frac{\hat{p}-p_0}{\sqrt{p_0(1-p_0)/n}}\sim N(0,1)$ - 有意水準:5%
- 帰無仮説:
$H_0:p=0.016$ ⇒ 原神の星5獲得確率は1.6% - 対立仮設:
$H_1:p\neq0.016$ ⇒ 原神の星5獲得確率は1.6%ではない - 両側検定を行う
p0 = 0.016 #原神公式で公開された星5の総合確率
n = wish_count
significance_level = 0.025 #有意水準設定
z = abs((p1-p0)/(math.sqrt((p0*(1-p0))/n)))
print("H0:星5が当たる確率は1.6%(P=0.016)")
print("H1:星5が当たる確率は1.6%ではない(P≠0.016)")
print("正規化したz値:",z)
z0 = abs(stats.norm.ppf(significance_level)) #標準正規分布の95%信頼区間のz値
print("有意水準5%で、両側検定のz値:",z0)
if z <= z0 :
    print("H0は棄却できない・H0を棄却するための十分な証拠がない")
else:
    print("H0が棄却され、H1を受容する")

H0:星5が当たる確率は1.6%(P=0.016)
H1:星5が当たる確率は1.6%ではない(P≠0.016)
正規化したz値: 0.004653100937838977
有意水準5%で、両側検定のz値: 1.9599639845400545
H0は棄却できない・H0を棄却するための十分な証拠がない
そして!もちろん、pythonerはこういう長いコードを書きたくありません。
また、優雅なるscipyの登場です。
区間推定・統計量検定、両方とも簡単にできます。
b = stats.binomtest(characters_5star_wish_count,n,p0) #確率関数のインスタンス
print("P値:",b.pvalue)
print("子集団の確率:",b.proportion_estimate)
#区間推定算出、パラメータのalternativeでtwo-sided(両側), greater(上側), less(下側)
#デフォルトはtwo-sided(両側)
interval = b.proportion_ci(0.95)
print("low:",interval.low)
print("high:",interval.high)
if b.pvalue < 0.05:
    print("弁護士を呼ぶ時が来た!")
else:
    print("一先ず安心、課金はほどほど")

P値: 1.0
子集団の確率: 0.015978695073235686
low: 0.008282974761761737
high: 0.02774507655042755
一先ず安心、課金はほどほど
おわり
プログラミングは楽しい事ですが、数学の深淵は奥深いです。
独学で勉強不足の部分があるかもしれませんが、本記事に間違いがあれば、コメントして頂けると幸いです。
最後は結構、気にいる言葉を引用します。
You want to program because you saw the amazing things that can be built using programming.
So don’t just learn how to program, build something that matters, build something that means something to you, build something that solves the problem.
You are a problem solver, a creator, an innovator.
You are not a programmer.
次のステップ
ここまでscipyを使ってデータ分析をやってみましたが、可視化とscipyの連携は時に上手く行かないケースがあることに痛感し、時間があれば、簡単にデータ分析・可視化できるライブラリが作りたいです。