時系列(time series)データをプロットするメモ
import pandas as pd
import matplotlib.pyplot as plt
%matplotlib inline
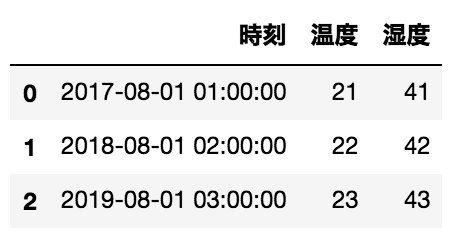
# 温度データ
df = pd.DataFrame({
'時刻': pd.to_datetime(['2017-08-01 01:00:00', '2018-08-01 02:00:00', '2019-08-01 03:00:00'])
,'温度': [21, 22, 23]
,'湿度': [41, 42, 43]
})
時刻データはpandasのTimestamp型であることを確認
type(df_temp.loc[0, '時刻'])
結果
pandas._libs.tslib.Timestamp
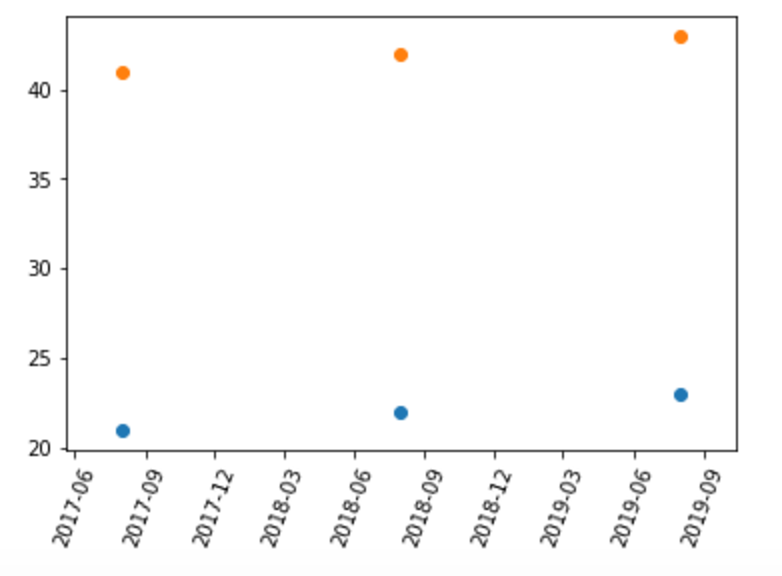
時刻をindexにして, plt.scatterでプロットするときにX軸はdf.indexとして指定する.
df = df.set_index('時刻')
plt.scatter(df.index, df['温度'])
plt.scatter(df.index, df['湿度'])

plt.xticks(rotation=70)

plt.show()
ソースコード
import pandas as pd
import matplotlib.pyplot as plt
%matplotlib inline

# 温度データ
df = pd.DataFrame({
    '時刻': pd.to_datetime(['2017-08-01 01:00:00', '2018-08-01 02:00:00', '2019-08-01 03:00:00'])
    ,'温度': [21, 22, 23]
    ,'湿度': [41, 42, 43]
})

df = df.set_index('時刻')
plt.scatter(df.index, df['温度'])
plt.scatter(df.index, df['湿度'])

plt.xticks(rotation=70)

plt.show()