当記事では異常検知のサーベイ論文(A Unifying Review
of Deep and Shallow Anomaly Detection)を元に異常検知について取りまとめました。
基本トピック
異常検知の概要
異常検知(Anomaly Detection)は正常(normal)な例からかけ離れた異常(anomaly)な例を検出するタスクであり、fail-safeやrobust designを議論する際によく出てきます。
・point anomalies
・conditional or contextual anomalies
・group or collective anomalies
・low-level sensory anomalies
・high-level semantic anomalie
検知する異常の種類については上記などが挙げられます。それぞれの意味については下図を元に掴むと良いと思います。

An illustration of the types of anomalies(異常検知サーベイ論文 Fig.2)
point anomaliesとgroup or collective anomaliesは左上の図から理解することができます。point anomaliesは一点だけが異常な場合、group or collective anomaliesはグループに属する何点かが異常な場合をそれぞれ指します。conditional or contextual anomaliesは左下の図から理解することができ、Conditionalはトレンド(時系列)の一点だけが異常な場合、contextualはそもそもトレンド全体が異常な場合をそれぞれ指します。
Low-levelとHigh-levelについてはDeepLearningの文脈でよく議論され、Low-levelは欠損や文字のtypoなどを指す一方で、High-levelはエッジのようなpixel-levelの変化に対応します。
また、異常検知はchallengingなタスクであり、このことは下記に起因します。
・正常な例のばらつきが多い
・異常な例のサンプルが少ない
・異常な例自体もばらつきが大きくmodelを作るのが難しい。
異常検知の式定義
データ空間$\mathcal{X} \in \mathbb{R}^{D}$における正常(normality)の分布を$\mathbb{P}^{+}$、$\mathbb{P}^{+}$に対応する確率密度関数(pdf; probability density function)の$p^{+}(\mathbf{x})$のように定義します。
このとき、データ空間上のデータ点$\mathbf{x} \in \mathcal{X}$を元に異常(anomaly)の集合を下記のように定義します。
\mathcal{A} = \{ \mathbf{x} \in \mathcal{X} | p^{+}(\mathbf{x}) \leq \tau \}, \quad \tau \geq 0
上記の$\tau$は正常か異常かを判断する閾値(threshold)であり、p^{+}(\mathbf{x})$が十分に低ければ異常と判断すると解釈すれば良いです。以下、ここでの数式表記を元にpoint anomaliesなどを数式で表します。
point anomaliesの式定義
\mathbf{x} \in \mathcal{A}
point anomaliesは異常の集合の$\mathcal{A}$を元に、上記のように定義することができます。
conditional or contextual anomalies
contextual anomaliesを取り扱うにあたっては、確率分布$\mathbb{P}^{+} \equiv \mathbb{P}^{+}_{X|T}$に対応する条件付き(conditional)の確率密度関数$p^{+}(\mathbf{x}|t)$を定義すれば良いです。
$t$は時系列(Time-series)に対応しており、文脈(contextual)を条件付き確率(conditional probability)の形式で表すと理解すれば良いと思います。
異常検知の分類

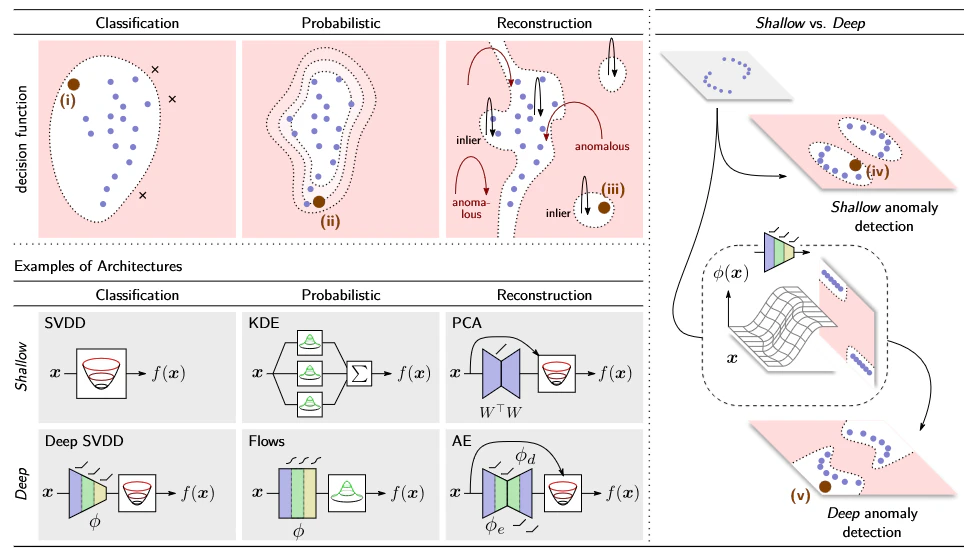
Anomaly detectionの手法①(異常検知サーベイ論文 Fig.1)
Anomaly detectionの手法②(異常検知サーベイ論文 Fig.5)
異常検知の分類については上の2つの図を元に理解すると良いです。以下ではサーベイ論文の目次に対応して、「Probabilistic」、「Classification」、「Reconstruction」の順にそれぞれ確認します。