Evaluating a Hypothesis
1. Model Selection
Break down our dataset into three sets:
- Traning set: 60%
- Cross Validation set: 20%
- Test set: 20%
Suppose we have several hypothesis functions with different polynomial degrees. To select the best model:
-
use the training set to optimize the parameters for each hypothesis function
-
use the validation set to find the best function (of the polynomial degree $d$) with the least error
-
use the test set with $J_{test}(Θ^{(d)})$ to estimate the generalization error (test set error)
2. Test Set Error
- Linear regression:
J_{test}(Θ) = \frac{1}{2m_{test}} \sum_{i=1}^{m_{test}} \bigl(h_Θ(x_{test}^{(i)})-y_{test}^{(i)} \bigr)^2
- Classification ~ Misclassification error:
err\bigl(h_Θ(x),y\bigr) =
\begin{array}{ll}
1 & if \, h_Θ(x)\geq0.5 \, and \, y=0 \, or \, h_Θ(x)\leq0.5 \, and \, y=1  \\
0 & otherwise
\end{array}
The average test error for the test set is:
Test Error = $\frac {1}{m_test} \sum_{i=1}^{m_{test}}err\bigl(h_Θ(x_{test}^{(i)}),y_{test}^{(i)} \bigr)$
This gives us the proportion of the test data that was misclassified.
Bias vs. Variance
1. Degree of the Polynomial d and B/V
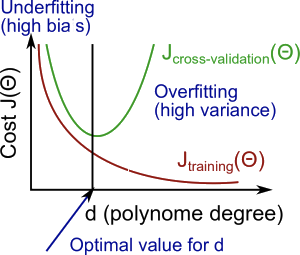
2. Regularization and B/V
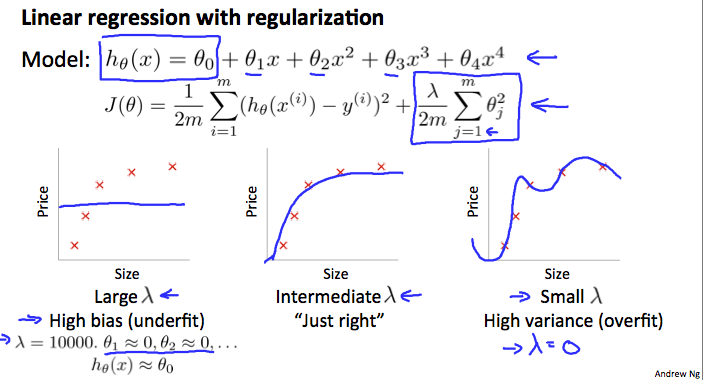
How to choose $\lambda$ :
- Create a list of lambdas (i.e. λ∈{0,0.01,0.02,0.04,0.08,0.16,0.32,0.64,1.28,2.56,5.12,10.24});
- Create a set of models with different degrees or any other variants.
- Iterate through the λs and for each λ go through all the models to learn some Θ.
- Compute the cross validation error using the learned Θ (computed with λ) on the $J_{CV}(Θ)$ without regularization or λ = 0.
- Select the best combo that produces the lowest error on the cross validation set.
- Using the best combo Θ and λ, apply it on $J_{test}(Θ)$ to see if it has a good generalization of the problem.
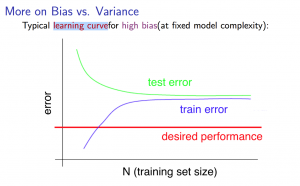
3. Learning Curves
-
Experiencing high bias:
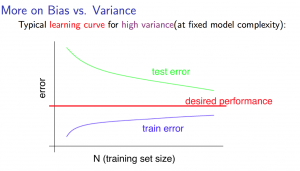
-
Experiencing high variance:
4. What to Do Next to Improve
Our decision process can be broken down as follows:
- Getting more training examples: Fixes high variance
- Trying smaller sets of features: Fixes high variance
- Adding features: Fixes high bias
- Adding polynomial features: Fixes high bias
- Decreasing λ: Fixes high bias
- Increasing λ: Fixes high variance
Error Analysis
- Start with a simple algorithm, implement it quickly, and test it early on your cross validation data.
- Plot learning curves to decide if more data, more features, etc. are likely to help.
- Manually examine the errors on examples in the cross validation set and try to spot a trend where most of the errors were made.
Choose Error Metrics:
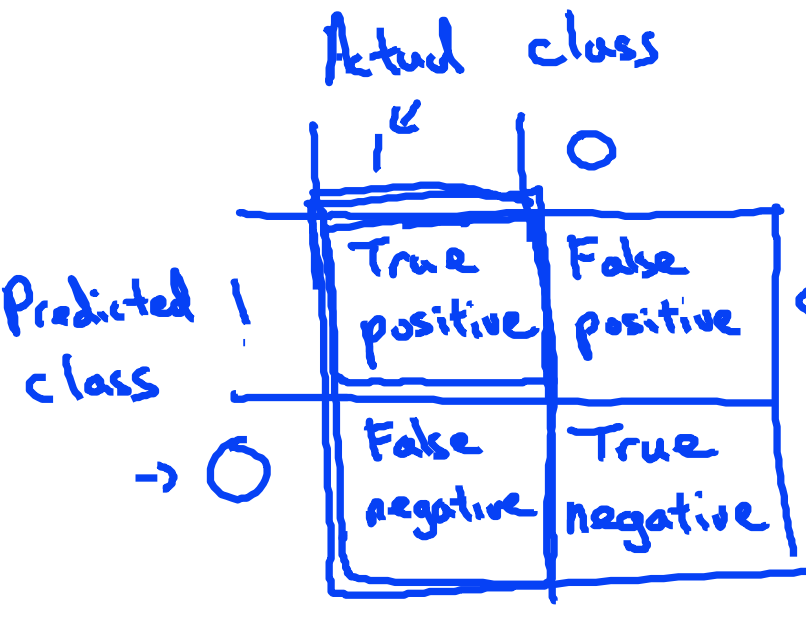
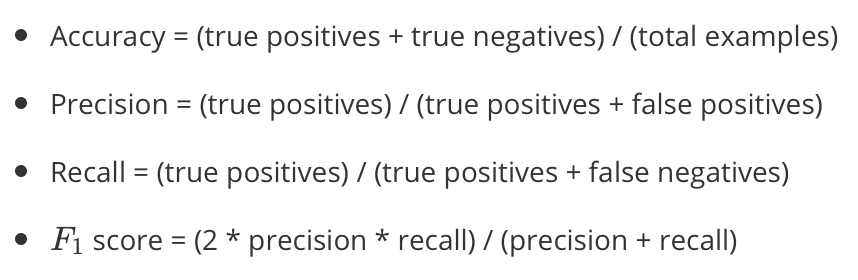
*Precision, Recall and F1 Score are good metrics paricularly when dealing with skewed data.
Using large data sets usually helps!
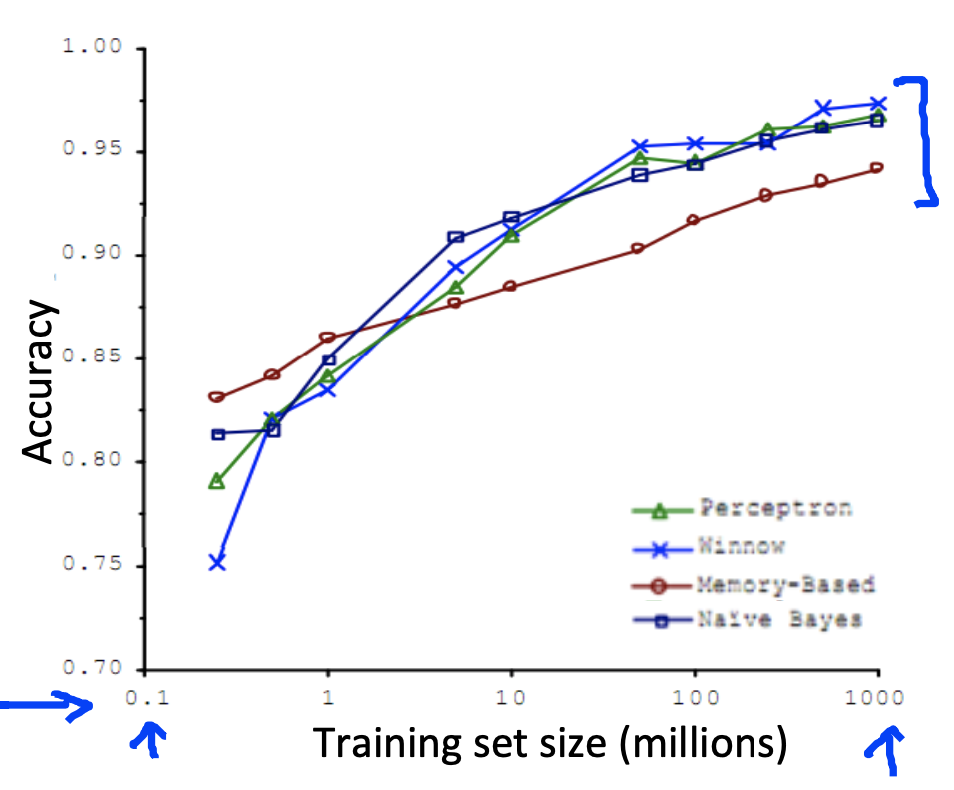
It’s not who has the best algorithm that wins.
It’s who has the most data.