概要説明
CesiumJSを使って地図の表示から町丁目ポリゴンの表示まで行います。
3Dマップ上に2Dポリゴン(町丁目ポリゴン)を表示させる目的は、特に深い理由があるわけではなく、どのように動作するのか試してみたいと思ったからです。
使用したもの
CesiumJS
CesiumJSは、3D地理空間アプリケーションを作成するためのオープンソースJavaScriptライブラリです
町丁目ポリゴン
町丁目とは行政界の一つで「富士見町3丁目」「広尾1丁目」など「●丁目」で表わされる行政区画のことです。行政界は他には都道府県や市区町村、大字などがあります。
町丁目ポリゴンとは町丁目の境界データであり、e-stat で 小地域(町丁・字等別)という名称で公開されています。
今回使用する町丁目ポリゴンは、TerraMap API からレスポンスされたGeoJSONです。
レスポンスされたGeoJSONのサンプル
{
  "type": "FeatureCollection",
  "features": [
      {
          "type": "Feature",
          "properties": {
              "area": {
                  "area": 0.1875635128037082
              },
              "point_coordinates": [
                  139.66641,
                  35.67514
              ],
              "geocode": "13113002802"
          },
          "geometry": {
              "type": "MultiPolygon",
              "coordinates": [
                  [
                      [
                          [
                              139.671072468,
                              35.675472254
                          ],
                          [
                              139.671087008,
                              35.675455055
                          ],
                          [
                              139.668725237,
                              35.674791116
                          ],
                          [
                              139.665545327,
                              35.673872239
                          ],
                          [
                              139.661458827,
                              35.672694079
                          ],
                          [
                              139.661419451,
                              35.672851547
                          ],
                          [
                              139.661380745,
                              35.672937476
                          ],
                          [
                              139.661480105,
                              35.673177857
                          ],
                          [
                              139.661702716,
                              35.673487731
                          ],
                          [
                              139.661785305,
                              35.673651366
                          ],
                          [
                              139.661614923,
                              35.674287572
                          ],
                          [
                              139.6614962,
                              35.674380922
                          ],
                          [
                              139.661459656,
                              35.674408793
                          ],
                          [
                              139.662425327,
                              35.674739902
                          ],
                          [
                              139.66654409,
                              35.676248336
                          ],
                          [
                              139.667841199,
                              35.676698291
                          ],
                          [
                              139.670456339,
                              35.677651212
                          ],
                          [
                              139.670879432,
                              35.675730569
                          ],
                          [
                              139.670937715,
                              35.675631642
                          ],
                          [
                              139.671072468,
                              35.675472254
                          ]
                      ]
                  ]
              ]
          }
      }
  ]
}
地図の表示
CesiumJSのクイックスタートを参考にしてindex.htmlを以下のように作成します。
YOUR_ACCESS_TOKEN部分はCesium ionで事前にアカウントを作成してからトークンを取得し、ソースコードを書き換える必要があります。
<!DOCTYPE html>
<html lang="ja">
<head>
  <meta charset="utf-8">
  <!-- Include the CesiumJS JavaScript and CSS files -->
  <script src="https://cesium.com/downloads/cesiumjs/releases/1.125/Build/Cesium/Cesium.js"></script>
  <link href="https://cesium.com/downloads/cesiumjs/releases/1.125/Build/Cesium/Widgets/widgets.css" rel="stylesheet">
</head>
<style>
html, body, #cesiumContainer {
  width: 100%;
  height: 100%;
  margin: 0;
  padding: 0;
}
</style>
<body>
  <div id="cesiumContainer"></div>
    <script type="module">
      // Your access token can be found at: https://ion.cesium.com/tokens.
      // This is the default access token from your ion account
      Cesium.Ion.defaultAccessToken = 'YOUR_ACCESS_TOKEN';

      // Initialize the Cesium Viewer in the HTML element with the `cesiumContainer` ID.
      const viewer = new Cesium.Viewer('cesiumContainer', {
        showCreditsOnScreen: true
      });

      // Fly the camera to San Francisco at the given longitude, latitude, and height.
      viewer.camera.flyTo({
        destination: Cesium.Cartesian3.fromDegrees(139.66641, 35.67514, 1600),
        orientation: {
          heading: Cesium.Math.toRadians(0.0),
          pitch: Cesium.Math.toRadians(-90.0),
        }
      });

      // Add Cesium OSM Buildings, a global 3D buildings layer.
      const buildingTileset = await Cesium.createOsmBuildingsAsync();
      viewer.scene.primitives.add(buildingTileset);
    </script>
  </div>
</body>
</html>
表示結果
ローカルサーバーを立ち上げて地図が表示されるか確認します。
(Visual Studio Codeの拡張機能Live Serverを使用しました)
カーキ一色のオブジェクトはCesium OSM Buildingsという、OpenStreetMapのデータをもとに生成された3D建物のレイヤーです。
GeoJSONファイルを読み込み町丁目ポリゴンを表示
続いてindex.htmlのscriptタグ内の最下部に以下のコードを追加してGeoJSONファイルを読み込み、地図上に町丁目のポリゴンを表示するようにします。
GeoJSONファイル(PolygonSample.geojson)はindex.htmlと同じ階層に配置しました。
viewer.dataSources.add(Cesium.GeoJsonDataSource.load('PolygonSample.geojson', {
  stroke: Cesium.Color.HOTPINK,
  fill: Cesium.Color.PINK,
  strokeWidth: 3,
  markerSymbol: '?'
}));
参考情報
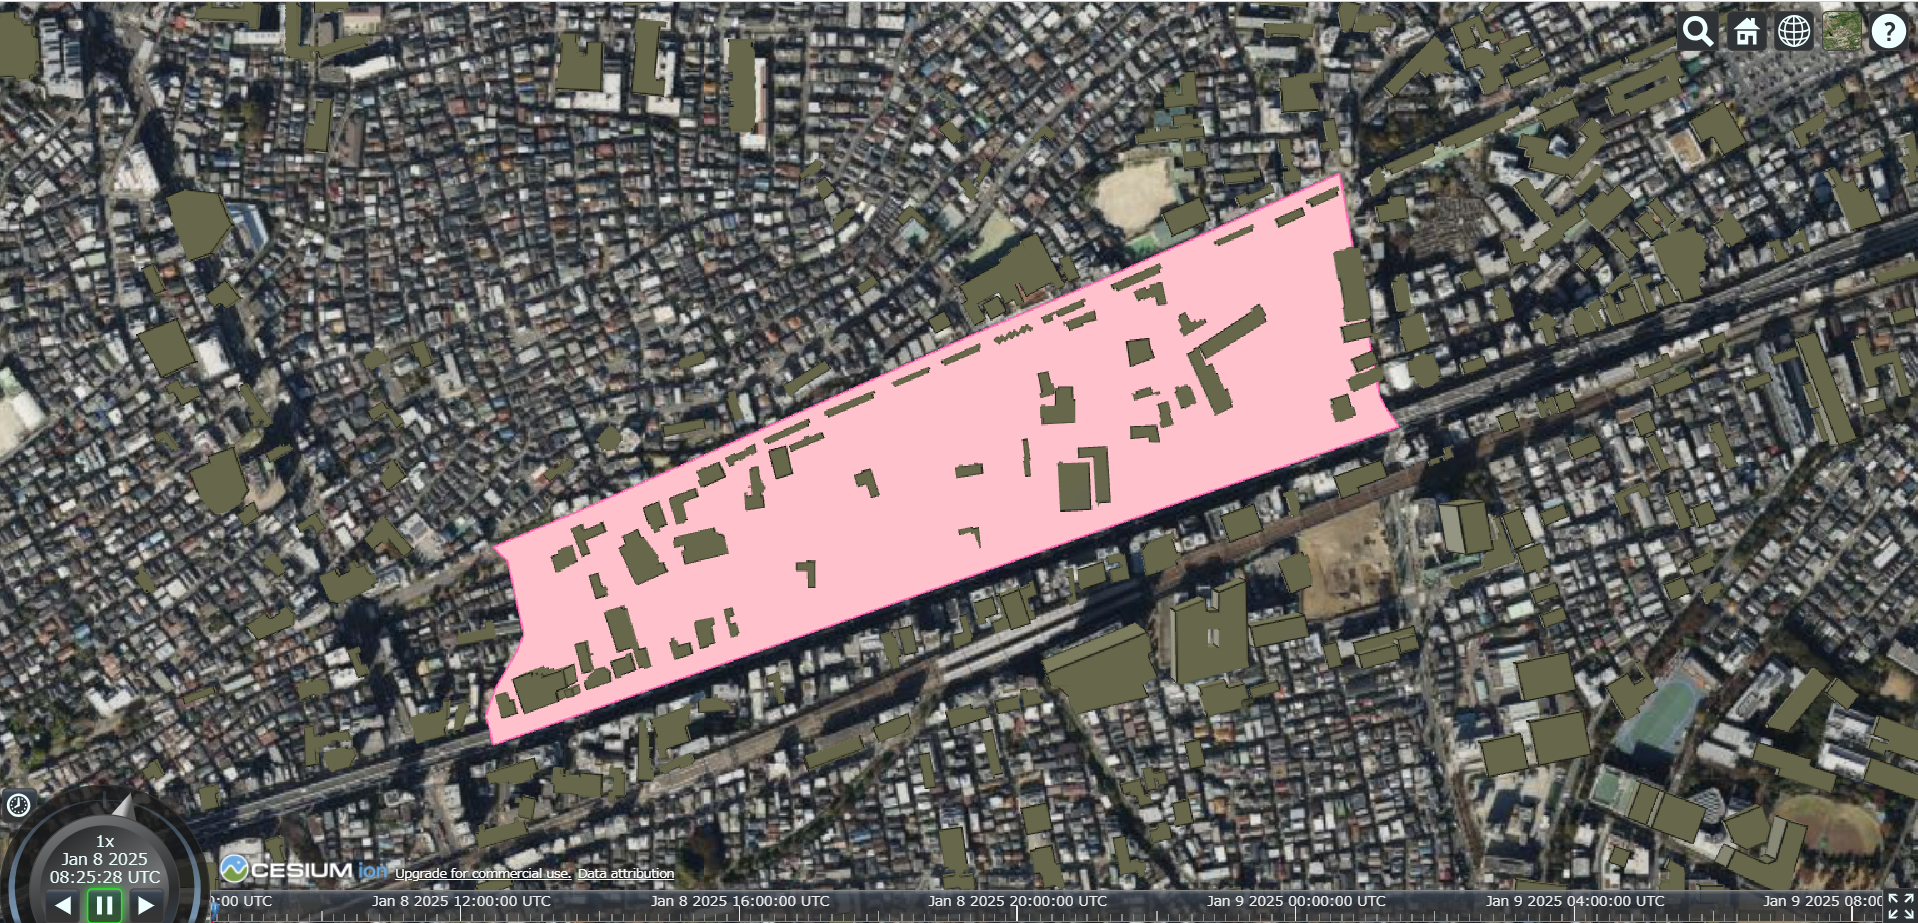
表示結果
GeoJSONで読み込んで表示されたピンク色の町丁目ポリゴンの上に、カーキ色の3D建物のレイヤーが目立っています。表示順は、町丁目ポリゴン、3D建物のレイヤーの順で描画されているようで、3D建物のレイヤーは町丁目ポリゴンとは別のレイヤーとして描画されています。

