はじめてのモニタリング
モニタリングツールを仕事で触る機会があったのだが、全然上手くいかなくて困ったので手順をここに残しておく。いろいろ見ていると、進化が激しいようでちょっとバージョンが違うとかなり操作が変わるようだ。この記事も数カ月たつ間に使えなくなるかも。
やりたいこと
node_exporter -> prometheus -> influxdb -> grafana
- node_exporterでホストを監視
- prometheusでnode_exporterのデータを取得
- prometheusのデータをinfluxdbへ保存
- grafanaでinfluxdbの情報取得して表示
環境
AWS EC2上でAmazon Linux
Influxdb
$ mkdir -p ~/data/influxdb
$ sudo docker run --rm -p 8086:8086 -p 8083:8083 -e INFLUXDB_ADMIN_ENABLED=true -v ~/data/influxdb:/var/lib/influxdb:rw influxdb &
influxdbをAmazon Linuxへインストール & Setup
参照元(http://kmikmy.hatenablog.com/entry/2018/08/25/130350)
$ cat <<EOF | sudo tee /etc/yum.repos.d/influxdb.repo
[influxdb]
name = InfluxDB Repository - RHEL 7
baseurl = https://repos.influxdata.com/rhel/7/\$basearch/stable
enabled = 1
gpgcheck = 1
gpgkey = https://repos.influxdata.com/influxdb.key
EOF
$ sudo yum install influxdb
$ influx
Connected to http://localhost:8086 version 1.7.8
InfluxDB shell version: 1.7.8
> CREATE DATABASE prometheus
node_exporter
$ wget https://github.com/prometheus/node_exporter/releases/download/v0.18.1/node_exporter-0.18.1.linux-amd64.tar.gz
$ tar xzf node_exporter-0.18.1.linux-amd64.tar.gz
$ cd node_exporter-0.18.1.linux-amd64
$ ./node_exporter &
Prometheus
$ wget https://github.com/prometheus/prometheus/releases/download/v2.13.0/prometheus-2.13.0.linux-amd64.tar.gz
$ tar xzf prometheus-2.13.0.linux-amd64.tar.gz
$ cd prometheus-2.13.0.linux-amd64/
次にprometheus.ymlを編集。
# my global config
global:
  scrape_interval:     15s # Set the scrape interval to every 15 seconds. Default is every 1 minute.
  evaluation_interval: 15s # Evaluate rules every 15 seconds. The default is every 1 minute.
  # scrape_timeout is set to the global default (10s).

# Alertmanager configuration
alerting:
  alertmanagers:
  - static_configs:
    - targets:
      # - alertmanager:9093

# Load rules once and periodically evaluate them according to the global 'evaluation_interval'.
rule_files:
  # - "first_rules.yml"
  # - "second_rules.yml"

# A scrape configuration containing exactly one endpoint to scrape:
# Here it's Prometheus itself.
scrape_configs:
  # The job name is added as a label `job=<job_name>` to any timeseries scraped from this config.
  - job_name: 'prometheus'

    # metrics_path defaults to '/metrics'
    # scheme defaults to 'http'.

    static_configs:
    - targets: ['localhost:9100']


remote_write:
  - url: "http://localhost:8086/api/v1/prom/write?db=prometheus"

remote_read:
  - url: "http://localhost:8086/api/v1/prom/read?db=prometheus"
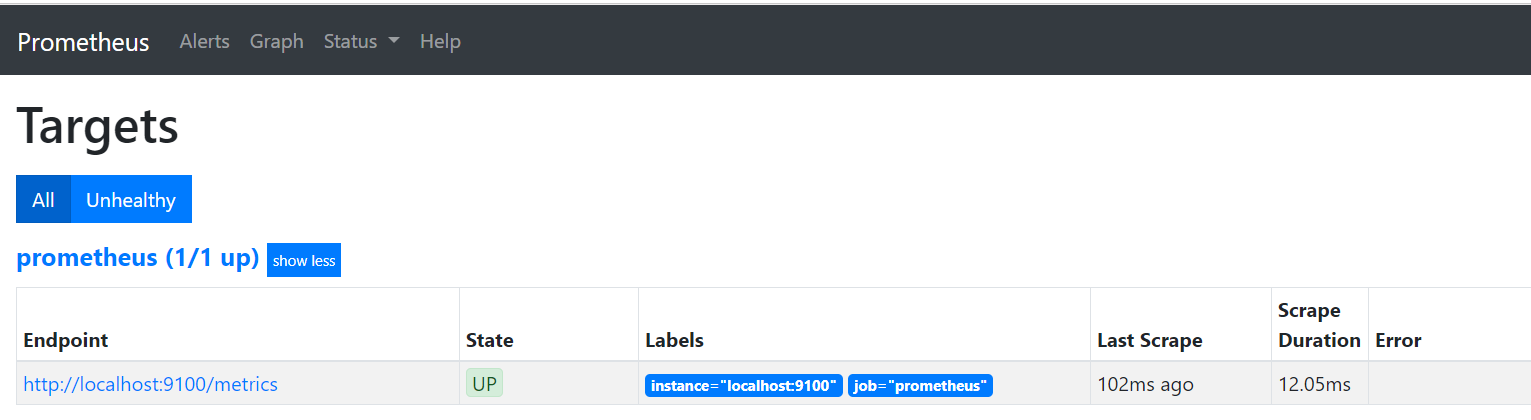
prometheusを起動。
./prometheus --config.file=prometheus.yml &
次に、ブラウザからprometheusへアクセスしてみる。URLに
IPアドレス:9090
を打ち込むとprometheusの画面が開けるはず。ここで、アクセスできない場合は、そのポートがブロックされていないか確認する。AWSであれば、セキュリティグループのインバウンドで「カスタム TCP ルール」で9090を開ける。ソースは社内からしか見ないのであれば、IPアドレスは縛った方がよいだろう。
grafana
参照元(http://blog.serverworks.co.jp/tech/2016/03/11/play-with-grafana-1/)
/etc/yum.repos.d/grafana.repoを作成し以下を追加
[grafana]
name=grafana
baseurl=https://packages.grafana.com/oss/rpm
repo_gpgcheck=1
enabled=1
gpgcheck=1
gpgkey=https://packages.grafana.com/gpg.key
sslverify=1
sslcacert=/etc/pki/tls/certs/ca-bundle.crt
grafanaをインストール
sudo yum install grafana
grafanaを起動
$ sudo service grafana-server start
ブラウザのULRに
IPアドレス:3000
を入力すると以下の画面が表示されるはず。prometheusと同様にポートを開いておくこと。

username/password共に、admin
次にdata sourceを追加する
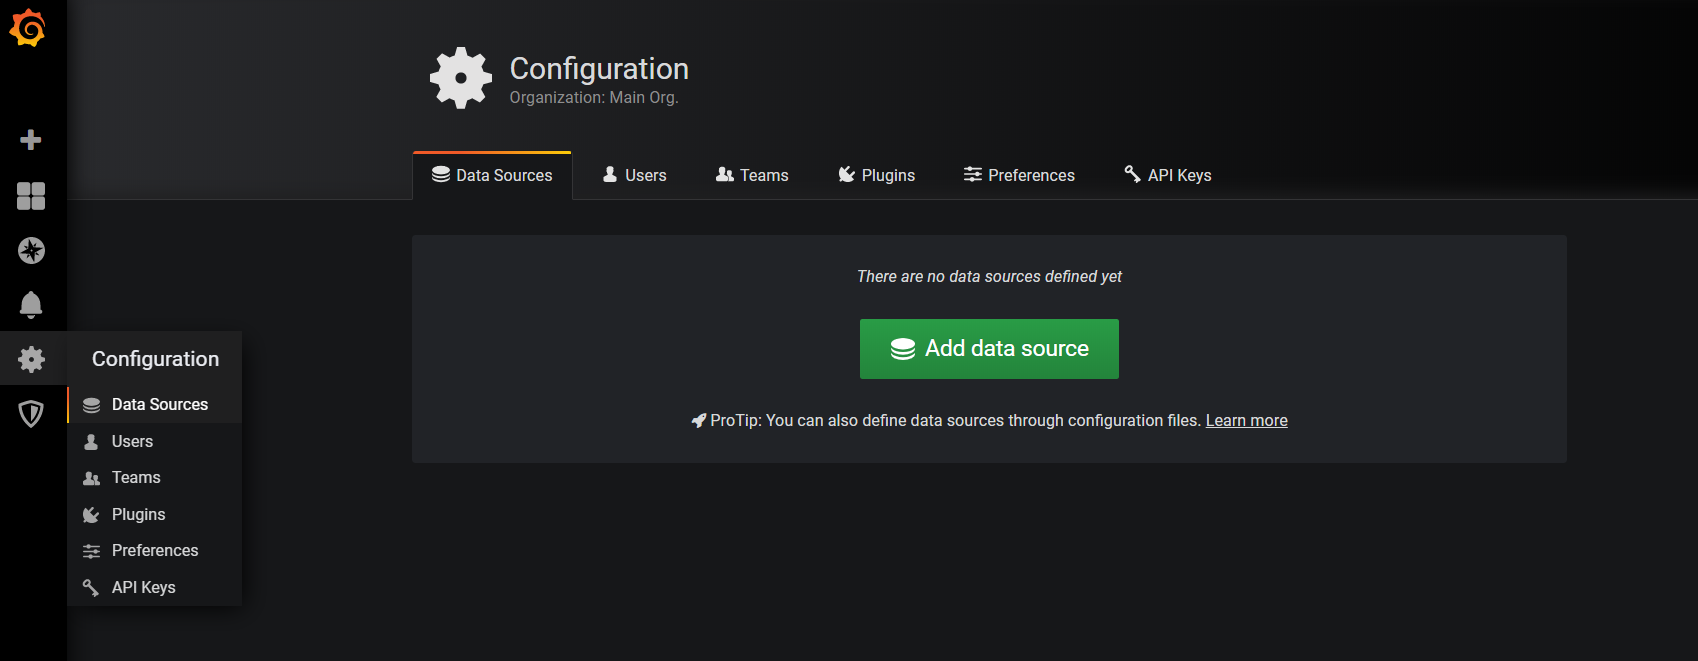
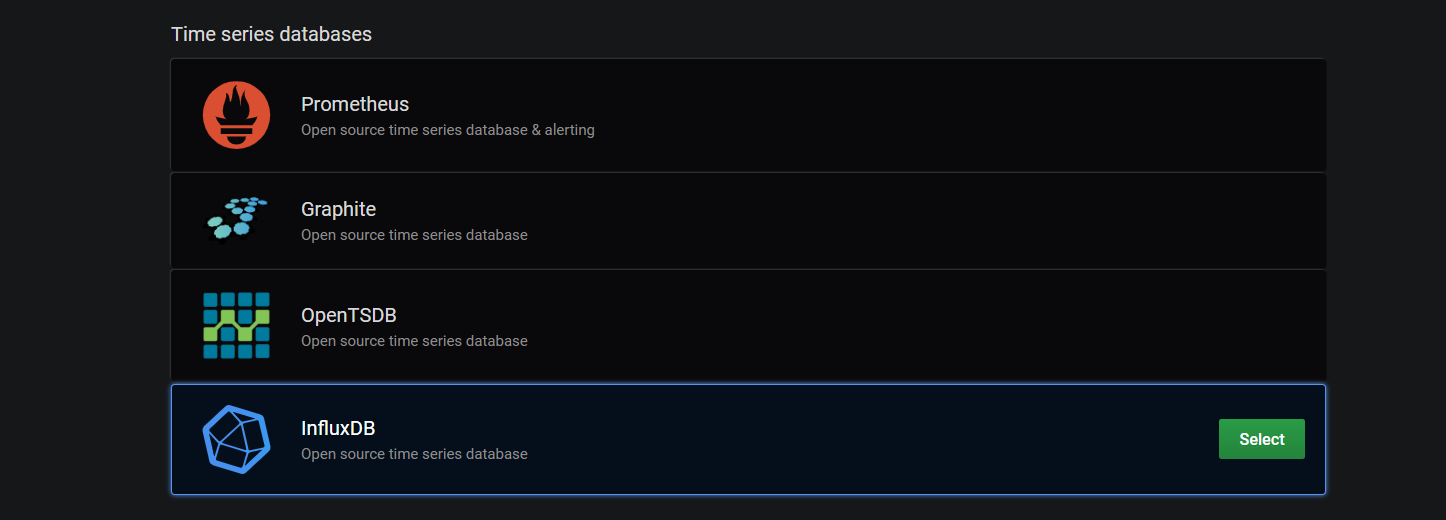
Add data sourceをクリックして、influxdbを選択する
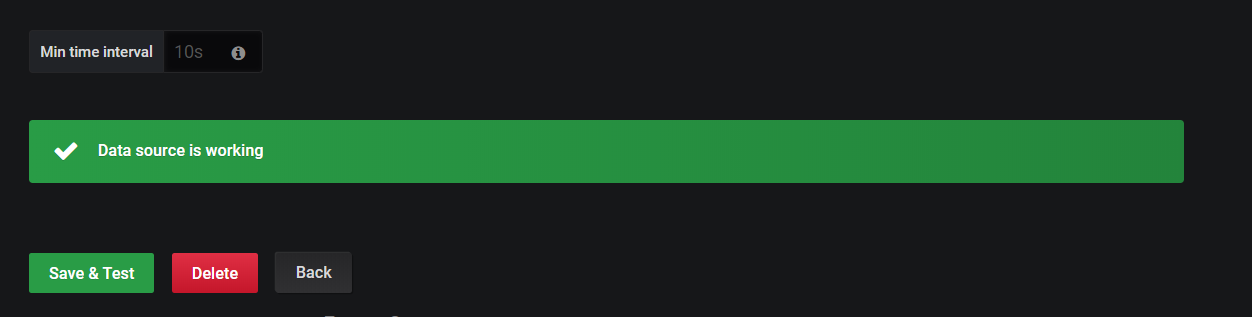
Influxdbへの接続を設定する
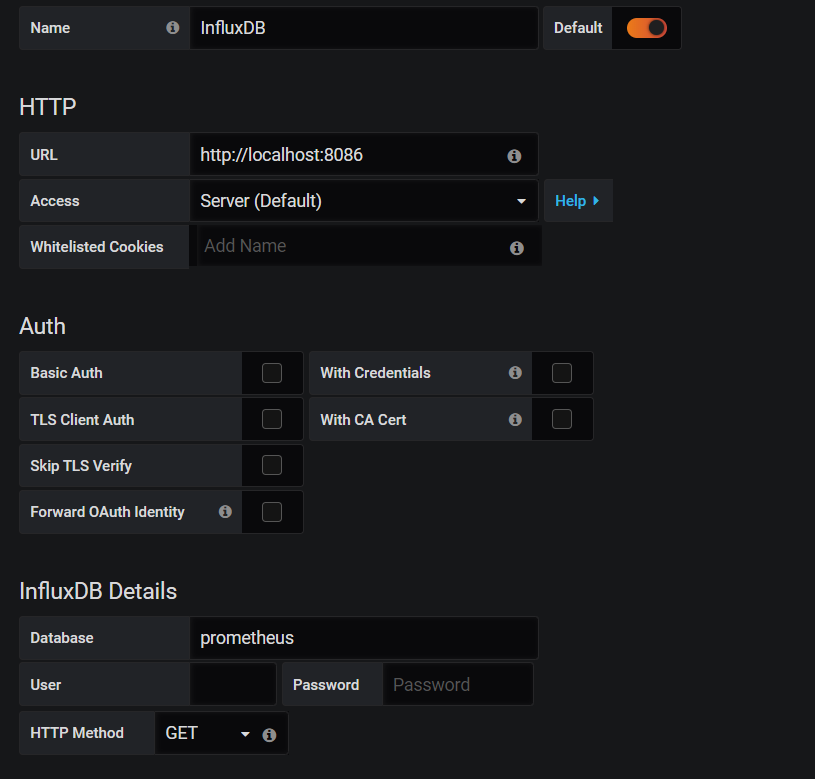
画面の下の方に「Save & Test」ボタンがあるのでクリックする。エラーの場合は、赤いバーが出る。
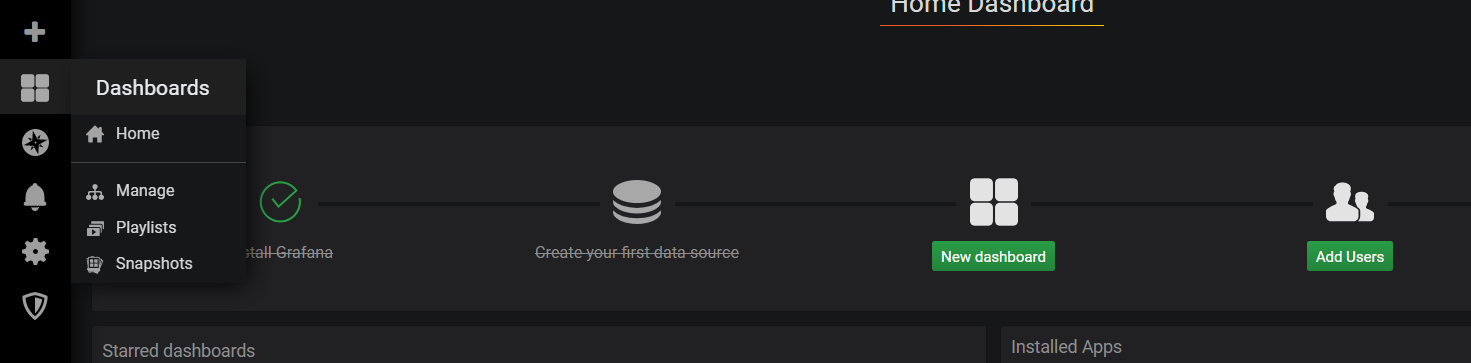
Dashboardを作る。New dashboardをクリックする。
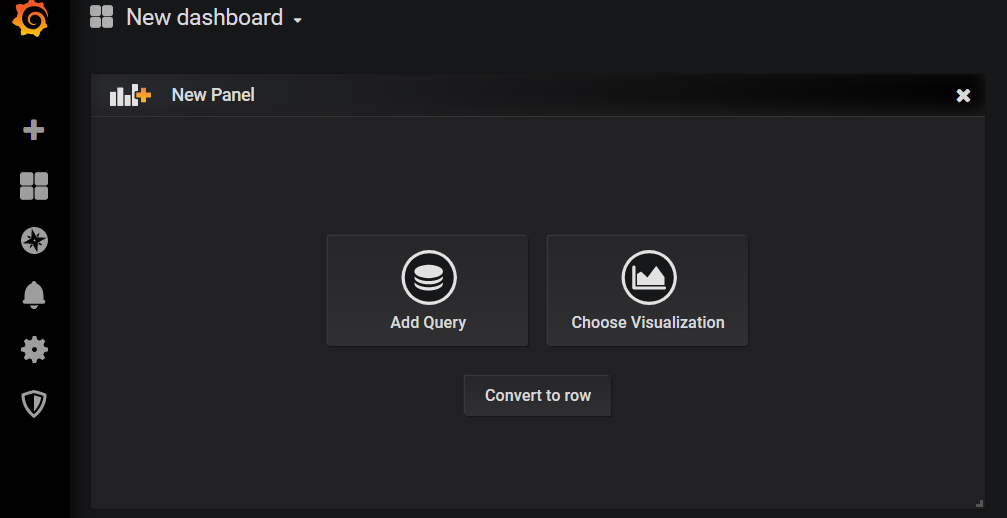
Add queryをクリックする。
Queryを作成する画面が出るが、このままだと少々分かりにくい。Aのところを二回くらいクリックすると表示が変わる
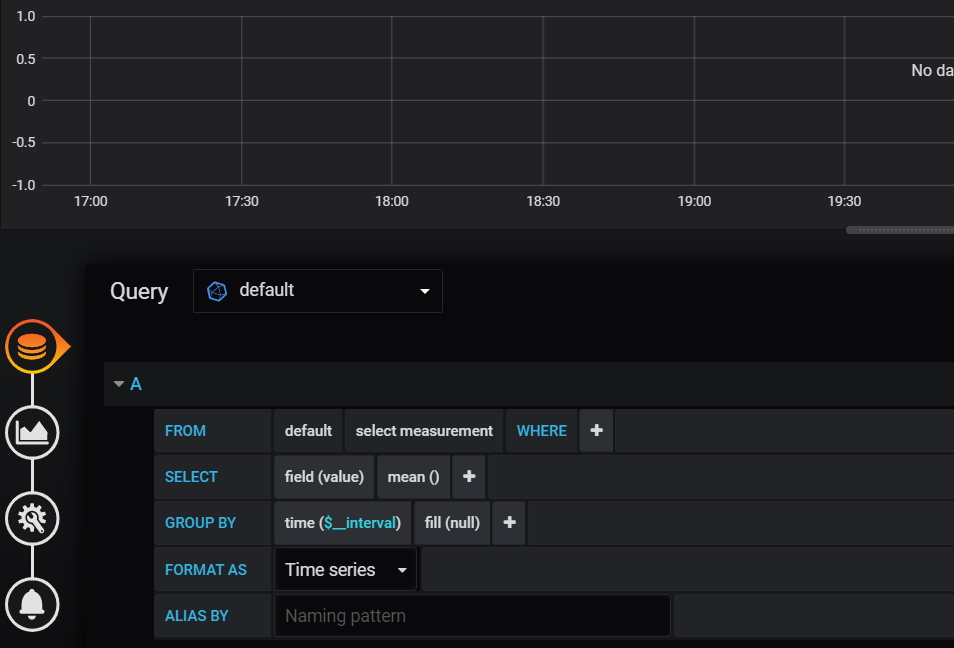
直接クエリを書いてあげる。今回はSELECT * FROM node_cpu_seconds_total
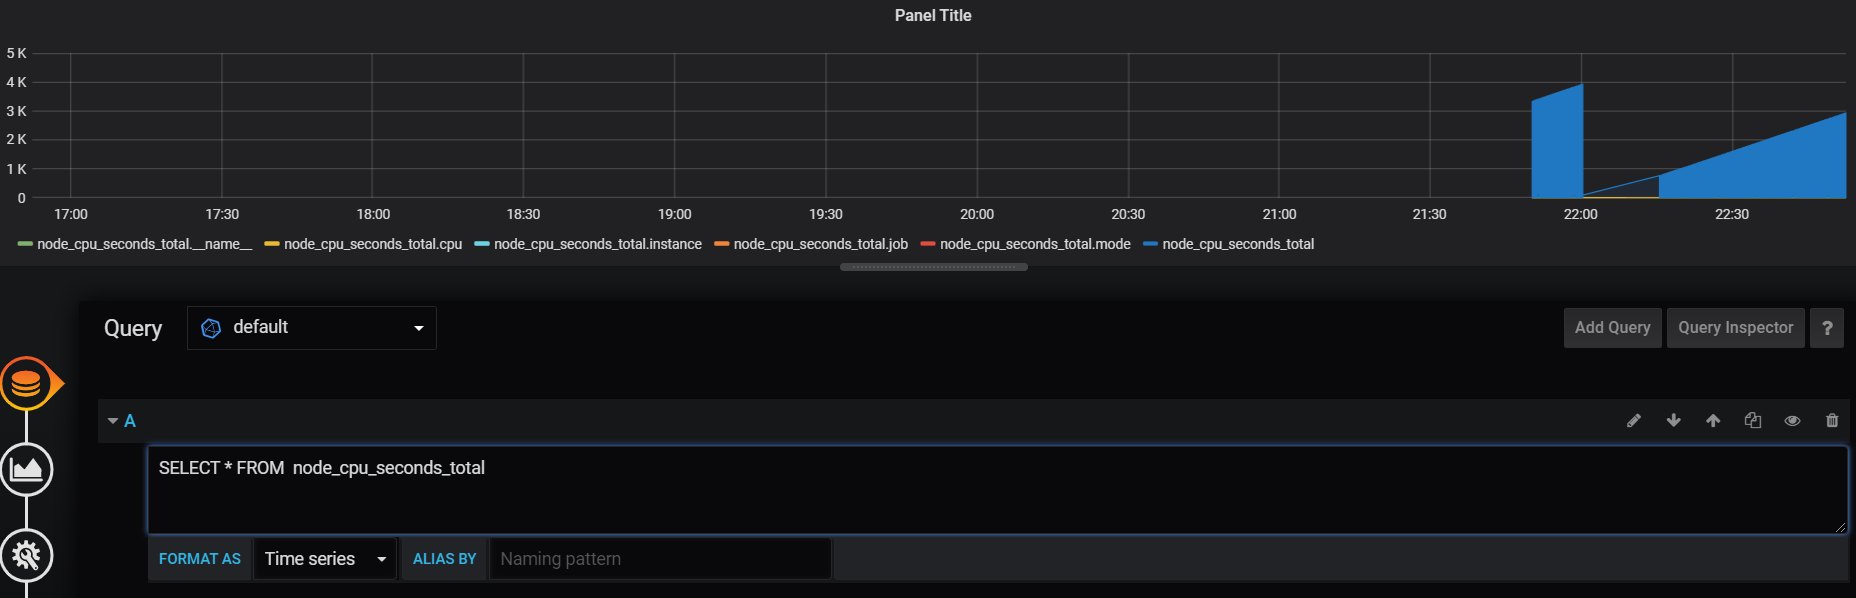
やっとグラフが表示された!!
所管
今回はとりあえず動かすところまでやりたかったので、セキュリティ面やどのデータをとるか、いろいろと細かいところは省略した。ただ、それでもかなり手こずった。いやー大変だった・・・。丸一日かかった。ネットでも似たようなことやってるサイトはあったが微妙にどれもやりたことと違っており苦戦した。次はこれをコンテナ化しよかな。