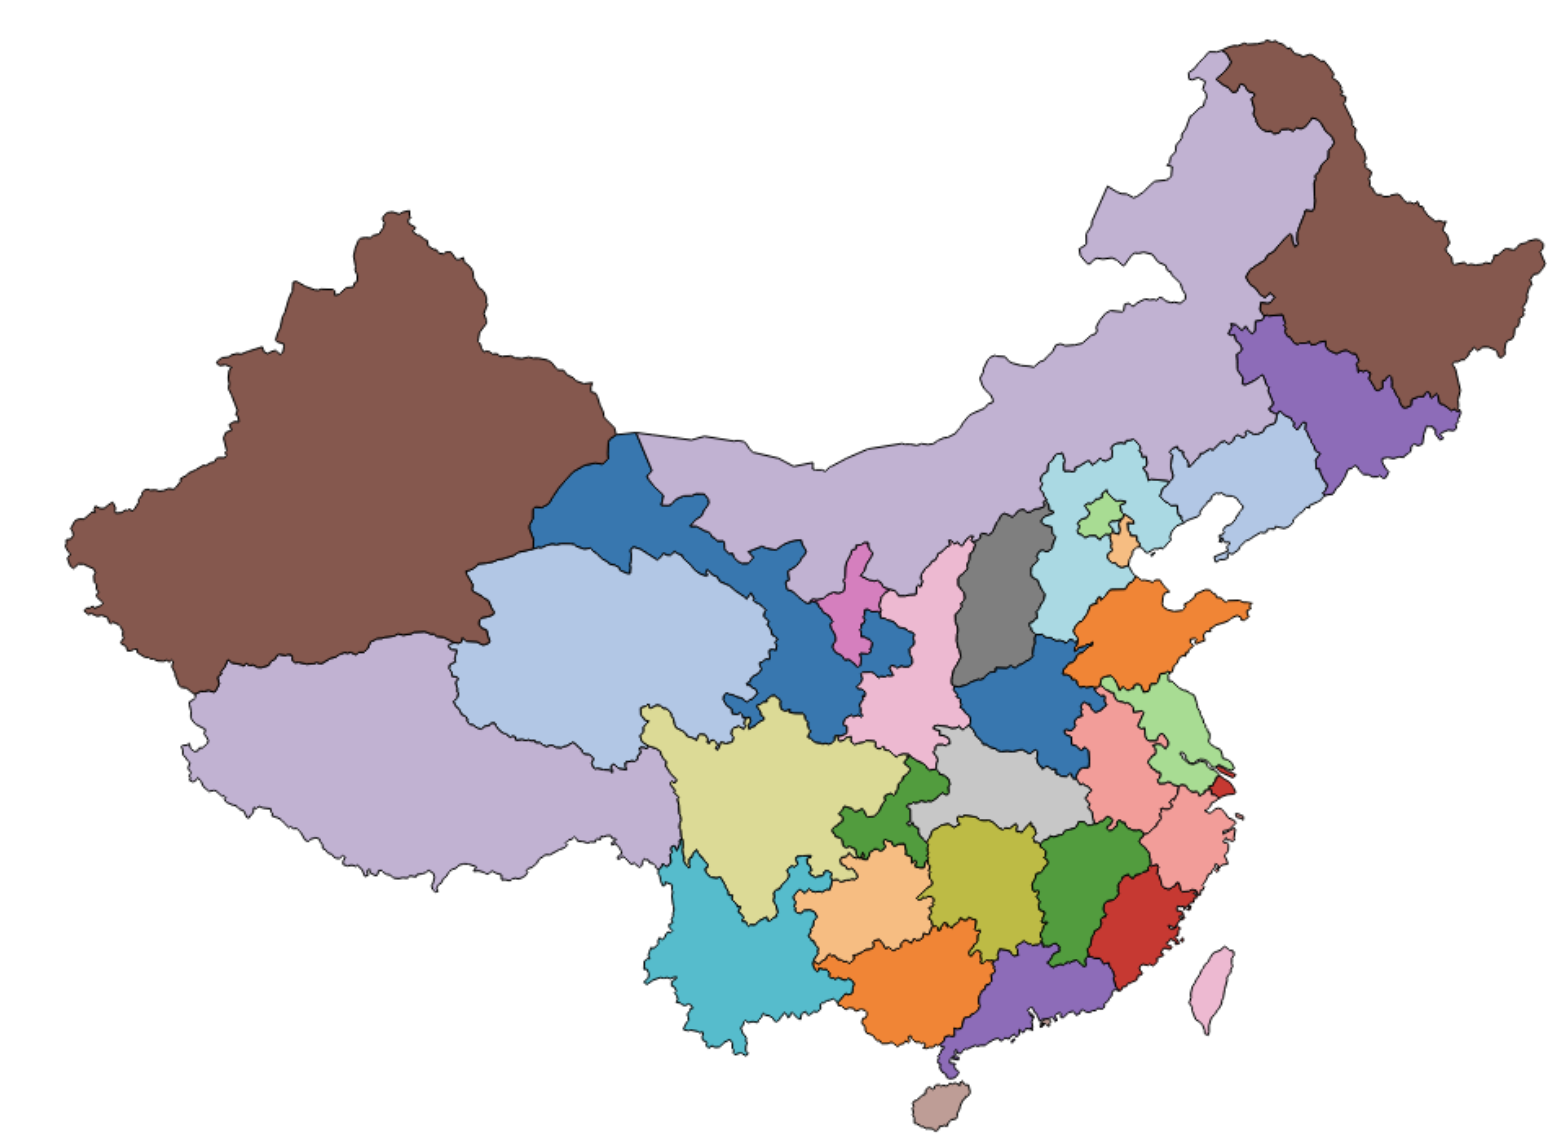
D3.jsは便利で地図を描くことができる。今回は中国地図をD3.jsで描いて、それを描く時使うGeoJsonフォーマットの注意点を話します。
1.地図データの獲得
地図を描くにはJSONファイルが必要、JSONを地理的データとして使う時、GeoJSONと呼んでいる。今回はこのようなファイルで地図を描く。
というより、どこで中国地図のGeoJSONファイルもらうかについて、やや難しいが、
もともとは、https://github.com/clemsos/d3-china-mapでGeoJSONファイルを作るべき、
ちょっと時間かかる必要があるため、今回作成済みのファイルを使わせてもらいます。
中国地図のGeoJSONファイル:china.geojson
このファイルはNatural Earth上のデータによって作成したものです。余計なものを排除して、省の名前やIDしか残ってません。
日本地図ならここにあります:日本地図
2.地図を描く
投影法
地図は地球という球体の一部を平面図したものですから、なんらかの投影法(プロジェクション)が必要となります。下記のように、d3.geo.mercator()を使います。
参考は https://github.com/mbostock/d3/wiki/Geo-Projections
    var projection = d3.geo.mercator
    .center([107, 31])
    .scale(850)
    .translate([width/2, height/2]);
center() 設定した地図の中心位置,[107,31] は経度、緯度
scale() 大きさの設定
線を引く
GeoJSONから経路を生成するため、d3.geo.path()を使う必要がある
var path = d3.geo.path()
    .projection(projection);
projection() は上で指定したプロジェクションの設定を反映したものとなります。
サーバーにリクエストして地図を描く
d3.json("china.json", function(error, root) {

    if (error)
        return console.error(error);
    console.log(root.features);

    svg.selectAll("path")
        .data( root.features )
        .enter()
        .append("path")
        .attr("stroke","#000")
        .attr("stroke-width",1)
        .attr("fill", function(d,i){
            return color(i);
        })
        .attr("d", path )   //経路を生成
        .on("mouseover",function(d,i){
                    d3.select(this)
                       .attr("fill","yellow");
                })
                .on("mouseout",function(d,i){
                    d3.select(this)
                       .attr("fill",color(i));
                });
});
ここのattr("d", path )は下記と同じ意味
.attr("d",funtion(d){
    return path(d);
})
