Introduction
Matplotlib has two interfaces:
- Object-oriented (OO) interface
- State-based interface
In this blog, I'll focus on 1. Object-oriented interface (OO interface).
What is Object-oriented interface?
In OO interface, there are two main instances:
1. Figure
2. Axes
One Figure has more than one Axes, each of which is for an individual plot.
Briefly speaking, you make a Figure instance as a canvas, and then draw plots using Axes instances.
Environment
- Python 3.7.12
- matplotlib 3.2.2
- pandas 1.3.5
Getting started
(Data preparation)
Data source: https://www.kaggle.com/rishidamarla/cancer-patients-data
plt_vis.py
import matplotlib.pyplot as plt
import pandas as pd # for data preperation

df = pd.read_excel("cancerDatasets.xlsx", header=0, index_col=0)
df_age = df.loc[:,"Age"]
At first, make a Figure and an Axes instances.
plt_vis.py
fig, ax = plt.subplots()

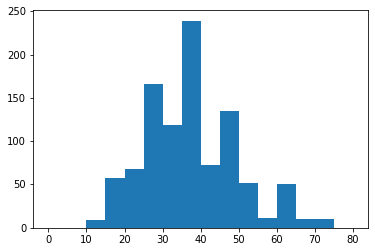
Then, you can plot the data using an Axes instance.
plt_vis.py
ax.hist(df_age, bins=range(0,81,5))
Customize
You can customize of figures by using methods that Axes class has.
Here, I'll introduce you some basic methods.
Add a title
plt_vis.py
ax.set_title("Distribution of age of patients")
Add labels of axes
plt_vis.py
ax.set_xlabel("Age")
ax.set_ylabel("Number of people")
Modify axis' tick locations
plt_vis.py
ax.set_yticks(range(0,251,25))
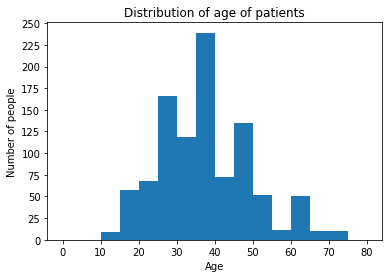
Also, you can the same customization as above with one method.
plt_vis.py
ax.hist(df_age, bins=range(0,81,5))
ax.set(title="Distribution of age of patients", xlabel="Age", ylabel="Number of people", yticks=range(0,251,25))