はじめに
Aidemy Premiumのカリキュラムの一環で、受講修了条件を満たすために公開しています。
2024年4月からAidemy Premiumにてデータ分析講座を受講しました。
その成果物として、与えられた患者データから薬剤を選択する予測モデルを構築してみました。
このページはデータ確認編です。(モデル構築・予測編はこちら)
この記事でわかる・できること
- 教師あり学習(分類)の流れがわかる
この記事の対象者
- データ分析初心者
動作環境・データセット
- OS バージョン
- Windows10 Pro 22H2
- 実装環境
- google colaboratory
- データセット
- 【kaggle】Drug.csv
データセット内容
今回のデータセットは、患者情報(年齢、性別、血圧、コレステロール値、ナトリウム、カリウムなど)と、医師が処方した薬剤から構成されています。内容は以下の通りです。
| index | Age | Sex | BP | Cholesterol | Na | K | Drug |
|---|---|---|---|---|---|---|---|
| 0 | 23 | F | HIGH | HIGH | 0.792535 | 0.031258 | drugY |
| 1 | 47 | M | LOW | HIGH | 0.739309 | 0.056468 | drugC |
| 2 | 47 | M | LOW | HIGH | 0.697269 | 0.068944 | drugC |
| 3 | 28 | F | NORMAL | HIGH | 0.563682 | 0.072289 | drugX |
| 4 | 61 | F | LOW | HIGH | 0.559294 | 0.030998 | drugY |
データの確認
データの概要
#Pandasのimport
import pandas as pd

#データの読み込み
df = pd.read_csv("Drug.csv")

# データの形を表示
print(f'Df_shape : {df.shape}\n')

# 各columnのデータ型を表示
print(f'{df.dtypes} \n')

#先頭5つを可視化
display(df.head())

#数値データの統計量を確認
display(df.describe())

#カテゴリカルデータの統計量を確認
display(df.describe(exclude='number'))
# データの形を表示
Df_shape : (200, 7)

# 各columnのデータ型を表示
Age              int64
Sex             object
BP              object
Cholesterol     object
Na             float64
K              float64
Drug            object
dtype: object

#先頭5つを可視化
Age	Sex	BP	Cholesterol	Na	K	Drug
0	23	F	HIGH	HIGH	0.792535	0.031258	drugY
1	47	M	LOW	HIGH	0.739309	0.056468	drugC
2	47	M	LOW	HIGH	0.697269	0.068944	drugC
3	28	F	NORMAL	HIGH	0.563682	0.072289	drugX
4	61	F	LOW	HIGH	0.559294	0.030998	drugY

#数値データの統計量を確認
Age	Na	K
count	200.000000	200.000000	200.000000
mean	44.315000	0.697095	0.050174
std	16.544315	0.118907	0.017611
min	15.000000	0.500169	0.020022
25%	31.000000	0.583887	0.035054
50%	45.000000	0.721853	0.049663
75%	58.000000	0.801494	0.066000
max	74.000000	0.896056	0.079788

#カテゴリカルデータの統計量を確認
Sex	BP	Cholesterol	Drug
count	200	200	200	200
unique	2	3	2	5
top	M	HIGH	HIGH	drugY
freq	104	77	103	91
- count項目から欠損値なし
- Drug項目から、unique:5に対しtop:drugYの割合が大きい
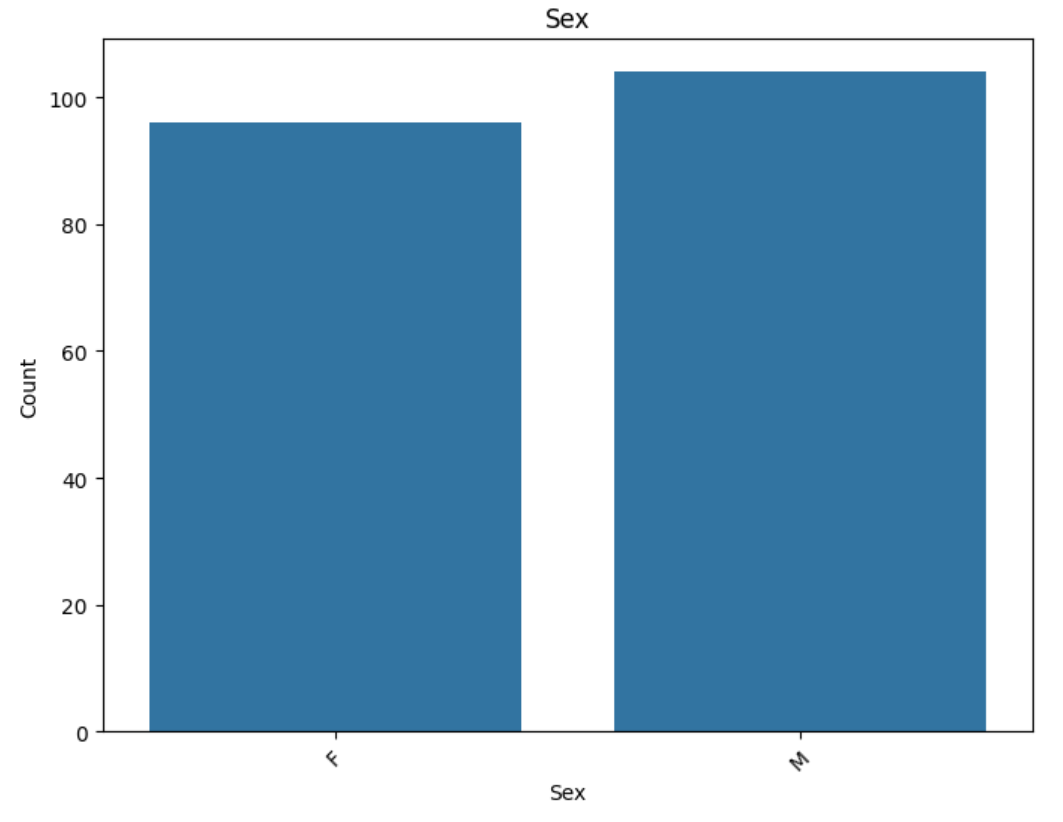
- Sex項目から、男女比は約半々
データ分布の可視化
#各カラムごとに度数分布表を作成する関数定義
def print_frequency_table(column):
    print("\nFeature:", column)
    print("Frequency table:")
    frequency_table = df[column].value_counts()
    total_samples = len(df)
    for category, count in frequency_table.items():
        percentage = (count / total_samples) * 100
        print(f"{category}: Count={count}, Percentage={percentage:.2f}%")

# カテゴリカルデータにおける度数分布表を表示させる
print("\nData type and frequency table for qualitative features:")
for column in df.select_dtypes(include=['object']):
    print_frequency_table(column)

# カテゴリカルデータのユニーク値を表示
print("\nUnique values in categorical columns:")
for column in df.select_dtypes(include=['object']):
    print(f"{column}: {df[column].unique()}")
Data type and frequency table for qualitative features:

Feature: Sex
Frequency table:
M: Count=104, Percentage=52.00%
F: Count=96, Percentage=48.00%

Feature: BP
Frequency table:
HIGH: Count=77, Percentage=38.50%
LOW: Count=64, Percentage=32.00%
NORMAL: Count=59, Percentage=29.50%

Feature: Cholesterol
Frequency table:
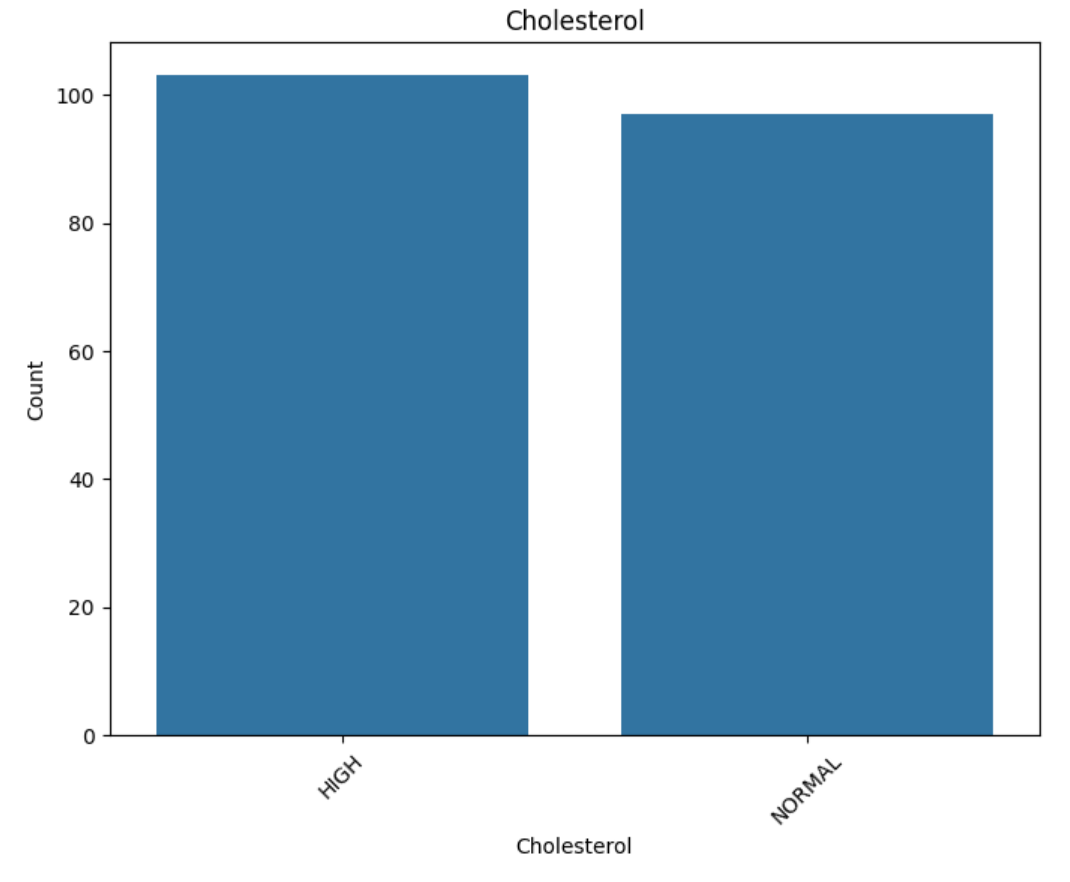
HIGH: Count=103, Percentage=51.50%
NORMAL: Count=97, Percentage=48.50%

Feature: Drug
Frequency table:
drugY: Count=91, Percentage=45.50%
drugX: Count=54, Percentage=27.00%
drugA: Count=23, Percentage=11.50%
drugC: Count=16, Percentage=8.00%
drugB: Count=16, Percentage=8.00%

Unique values in categorical columns:
Sex: ['F' 'M']
BP: ['HIGH' 'LOW' 'NORMAL']
Cholesterol: ['HIGH' 'NORMAL']
Drug: ['drugY' 'drugC' 'drugX' 'drugA' 'drugB']
わかりにくいのでグラフで可視化することに
#グラフによるカテゴリカルデータの可視化
import seaborn as sns

def plot_feature(feature):
    if df[feature].dtype == 'object':  # Categorical feature
        plt.figure(figsize=(8, 6))
        sns.countplot(x=feature, data=df)
        plt.title(f'{feature}')
        plt.xlabel(feature)
        plt.ylabel('Count')
        plt.xticks(rotation=45)


for feature in df.columns[:]:
    plot_feature(feature)
グラフから
- Sex,BP,Cholesterolはユニーク値ごとに大きな偏りはなさそう
- ターゲット変数(Drug)はdrugYが極端に多く、drugA,B,Cは少なめ
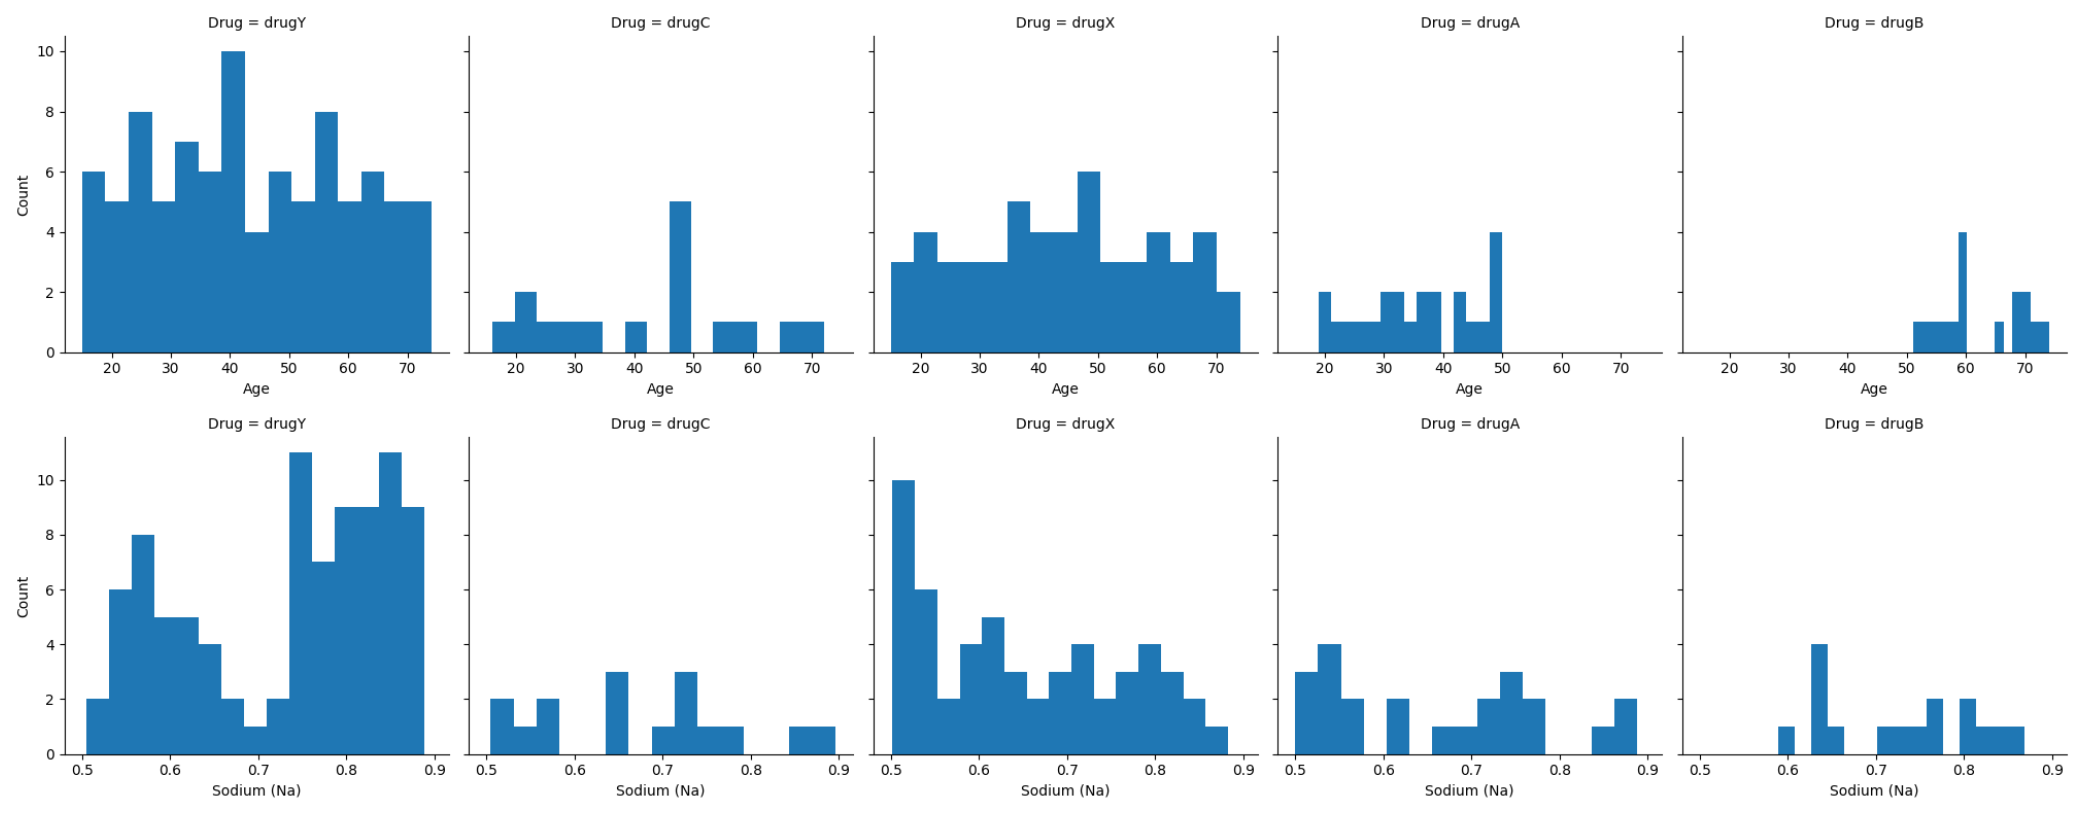
- DrugはAge,K,Naに影響されそう
# `Age`のボックスプロット作成
df.boxplot(column=['Age'], figsize=(8, 6))
plt.title('Box Plot of Age')
plt.ylabel('Value')
plt.xlabel('Feature')
plt.show()

# 'K'のヒストグラム作成
plt.figure(figsize=(8, 6))
plt.hist(df['K'], bins=20, color='lightgreen', edgecolor='black')
plt.title('Histogram of Potassium (K)')
plt.xlabel('Potassium (K)')
plt.ylabel('Frequency')
plt.grid(True)
plt.show()

# 'Na'のヒストグラム作成
plt.figure(figsize=(8, 6))
plt.hist(df['Na'], bins=20, color='skyblue', edgecolor='black')
plt.title('Histogram of Sodium (Na)')
plt.xlabel('Sodium (Na)')
plt.ylabel('Frequency')
plt.grid(True)
plt.show()
グラフから
- Ageは15~74歳で大きなばらつきはなさそう
- Na,Kは全体的にやや高めか
データ相関の可視化
# カテゴリカルデータとDrugの相関図を作成する関数定義
def plot_feature_vs_target(feature):
    if df[feature].dtype == 'object':
        plt.figure(figsize=(8, 6))
        sns.countplot(x=feature, hue='Drug', data=df)
        plt.title(f'{feature} vs Drug')
        plt.xlabel(feature)
        plt.ylabel('Count')
        plt.legend(title='Drug', loc='upper right')
        plt.xticks(rotation=45)

        # %をグラフ上に表示させる
        total_count_all = df.shape[0]
        for drug in df['Drug'].unique():
            total_count = df[df['Drug'] == drug].shape[0]
            for i, p in enumerate(plt.gca().patches):
                if p.get_height() > 0:
                    if i % len(df['Drug'].unique()) == df['Drug'].unique().tolist().index(drug):
                        plt.text(p.get_x() + p.get_width() / 2.,
                                 p.get_height() + 0.5,
                                 f'{p.get_height() / total_count_all * 100:.1f}%',
                                 ha='center', va='bottom')


# 各カラムごとに反復処理
for feature in df.columns[:-1]:
    plot_feature_vs_target(feature)
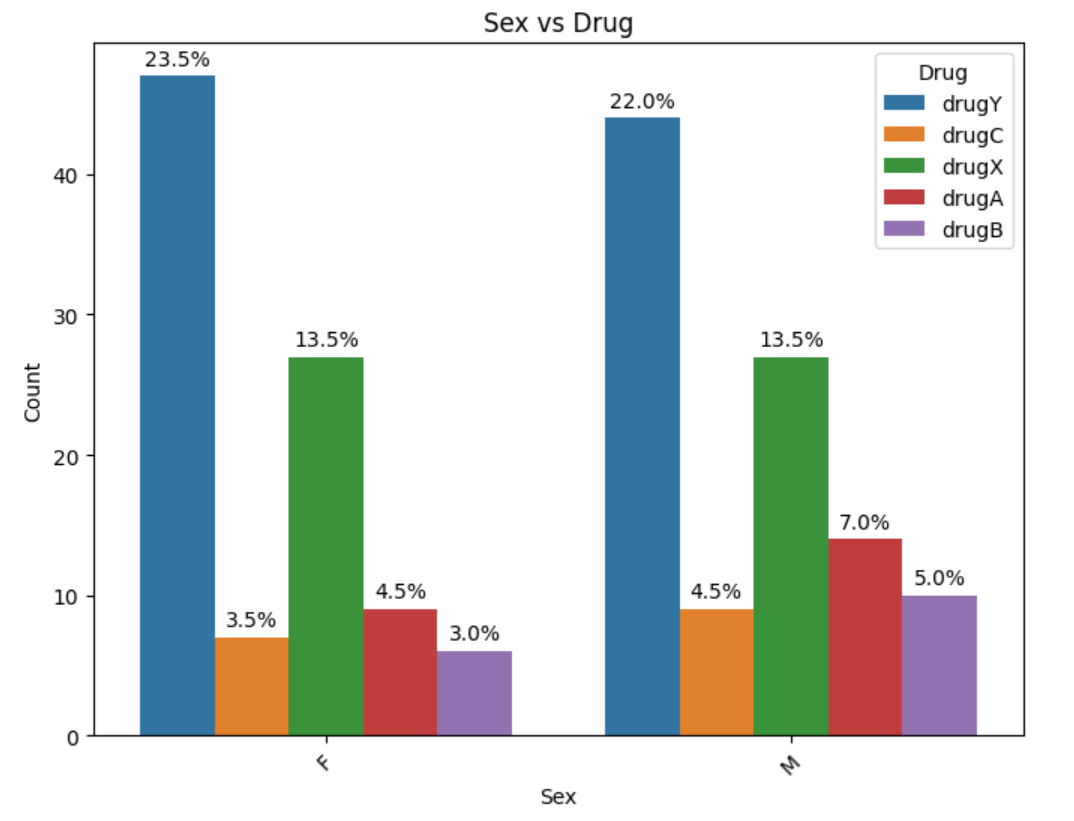
グラフから
- Sex vs Drugから、女性の方がややdrugA~C高めか
- BP vs Drugから、BPのユニーク値ごとにDrug分布が大きく異なり、DrugはBPの影響を強く受けそう
- Cholesterol vs Drugから、BPほどではないがユニーク値ごとに分布が異なる
from scipy.stats import chi2_contingency

# DrugとSexのクロス集計表を作成
contingency_table = pd.crosstab(df['Drug'], df['Sex'])

# カイ二乗検定を実行し、カイ二乗値、p値、自由度、期待度数を取得
chi2, p, dof, expected = chi2_contingency(contingency_table)
print("カイ二乗値:", chi2)
print("p値:", p)
print("自由度:", dof)
print("期待度数:", expected)
print("Contingency Table:")
display(contingency_table)

# 期待度数の最小値が5未満の場合の警告を表示
expected_min_count = expected.min().min()
if expected_min_count < 5:
    print("WARNING: Expected frequencies in the contingency table are below 5. Consider merging categories or using another test.")

# データ数が40未満の場合の警告を表示
sample_size = len(df)
if sample_size < 40:
    print("WARNING: Sample size is below 40. Consider increasing sample size for more reliable results.")
カイ二乗分布表より、発生確率0.05未満のカイ二乗値は9.4877
今回算出されたカイ二乗値は2.119248418109203であり、9.4877よりも低い値
よって「2つの指標は互いに独立している」という帰無仮説は棄却されず、
DrugとSexは互いに独立である

カイ二乗検定の超基本を確率分布から考える。| econoshift.com
# AgeのヒストグラムをFacetGridにマップする
g = sns.FacetGrid(df, col='Drug', height=4)
g.map(plt.hist, 'Age', bins=15)
g.set_axis_labels('Age', 'Count')
g.set_titles('Drug = {col_name}')
plt.show()

# NaのヒストグラムをFacetGridにマップする
g = sns.FacetGrid(df, col='Drug', height=4)
g.map(plt.hist, 'Na', bins=15)
g.set_axis_labels('Sodium (Na)', 'Count')
g.set_titles('Drug = {col_name}')
plt.show()

# KのヒストグラムをFacetGridにマップする
g = sns.FacetGrid(df, col='Drug', height=4)
g.map(plt.hist, 'K', bins=15)
g.set_axis_labels('Potassium (K)', 'Count')
g.set_titles('Drug = {col_name}')
plt.show()
from sklearn.preprocessing import LabelEncoder

# DrugをLabelEncoder()を使用して数値に変換
label_encoder = LabelEncoder()
df['Drug'] = label_encoder.fit_transform(df['Drug'])

# 数値データ
numerical_features = ['Age', 'Na', 'K']

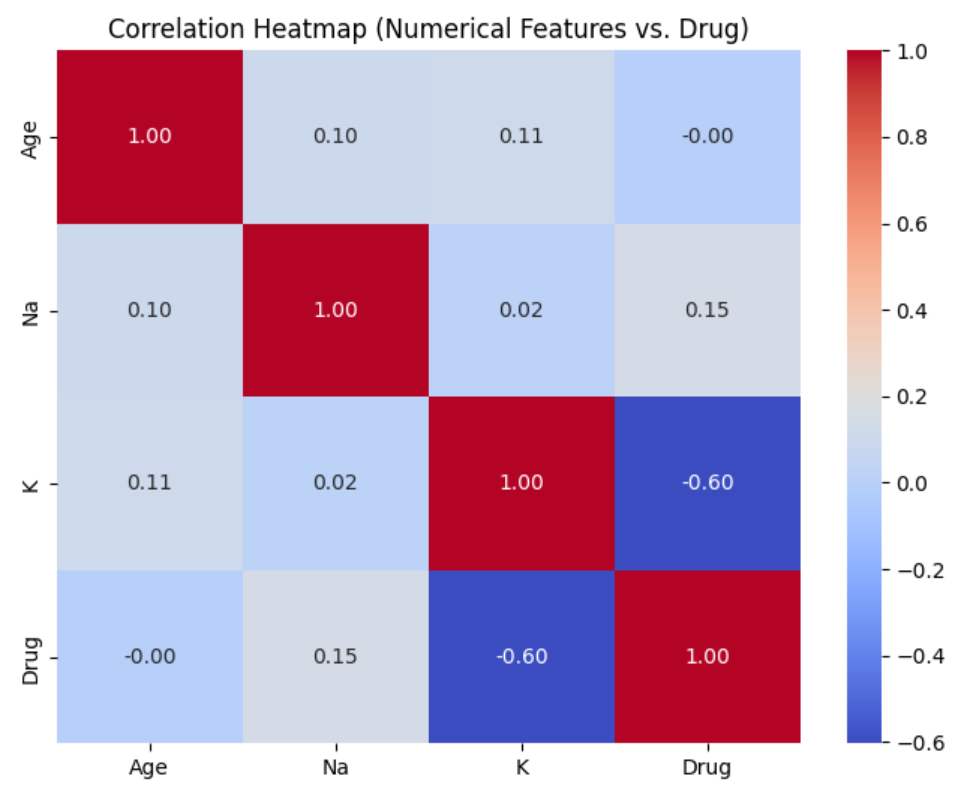
# 数値データのピアソン相関係数を計算。
correlation_matrix = df[numerical_features + ['Drug']].corr()

# ヒートマップを使って相関関係を視覚化
plt.figure(figsize=(8, 6))
sns.heatmap(correlation_matrix, annot=True, cmap='coolwarm', fmt=".2f")
plt.title('Correlation Heatmap (Numerical Features vs. Drug)')
plt.show()
DrugとKの間に負の相関があることを確認
from scipy.stats import pearsonr, spearmanr

# すべての数値特徴のペアについて、ピアソンおよびスピアマンの相関係数とp値を計算
correlation_results = {}

for i, feature1 in enumerate(numerical_features):
    for j, feature2 in enumerate(numerical_features):
        if i < j:  # 重複するペアを避ける
            # ピアソンの積立相関係数とp値を計算
            correlation_coefficient_pearson, p_value_pearson = pearsonr(df[feature1], df[feature2])
            # スピアマンの順位相関係数とp値を計算
            correlation_coefficient_spearman, p_value_spearman = spearmanr(df[feature1], df[feature2])
            correlation_results[(feature1, feature2)] = {
                'Pearson': (correlation_coefficient_pearson, p_value_pearson),
                'Spearman': (correlation_coefficient_spearman, p_value_spearman)
            }

# 計算結果を表示する
for (feature1, feature2), results in correlation_results.items():
    print(f"Correlation between {feature1} and {feature2}:")
    pearson_coefficient, pearson_p_value = results['Pearson']
    spearman_coefficient, spearman_p_value = results['Spearman']
    print("Pearson correlation:")
    print(f"- Coefficient: {pearson_coefficient:.2f}")
    print(f"- P-value: {pearson_p_value:.4f}")
    if pearson_p_value < 0.05:
        print("  (Statistically significant)")
    else:
        print("  (Not statistically significant)")
    print("Spearman rank correlation:")
    print(f"- Coefficient: {spearman_coefficient:.2f}")
    print(f"- P-value: {spearman_p_value:.4f}")
    if spearman_p_value < 0.05:
        print("  (Statistically significant)")
    else:
        print("  (Not statistically significant)")
    print()
Correlation between Age and Na:
Pearson correlation:
- Coefficient: 0.10
- P-value: 0.1573
  (Not statistically significant)
Spearman rank correlation:
- Coefficient: 0.09
- P-value: 0.1900
  (Not statistically significant)

Correlation between Age and K:
Pearson correlation:
- Coefficient: 0.11
- P-value: 0.1160
  (Not statistically significant)
Spearman rank correlation:
- Coefficient: 0.11
- P-value: 0.1230
  (Not statistically significant)

Correlation between Na and K:
Pearson correlation:
- Coefficient: 0.02
- P-value: 0.8075
  (Not statistically significant)
Spearman rank correlation:
- Coefficient: -0.01
- P-value: 0.9417
  (Not statistically significant)
Age,Na,Kの間には相関はない
plt.figure(figsize=(8, 6))
sns.regplot(x='Na', y='K', data=df, scatter_kws={'alpha':0.5})
plt.title('Scatter Plot of Na vs K')
plt.xlabel('Sodium (Na)')
plt.ylabel('Potassium (K)')
plt.grid(True)
plt.show()
class_names_full = {
    0: "drugA",
    1: "drugB",
    2: "drugC",
    3: "drugX",
    4: "drugY"
}

plt.figure(figsize=(8, 6))
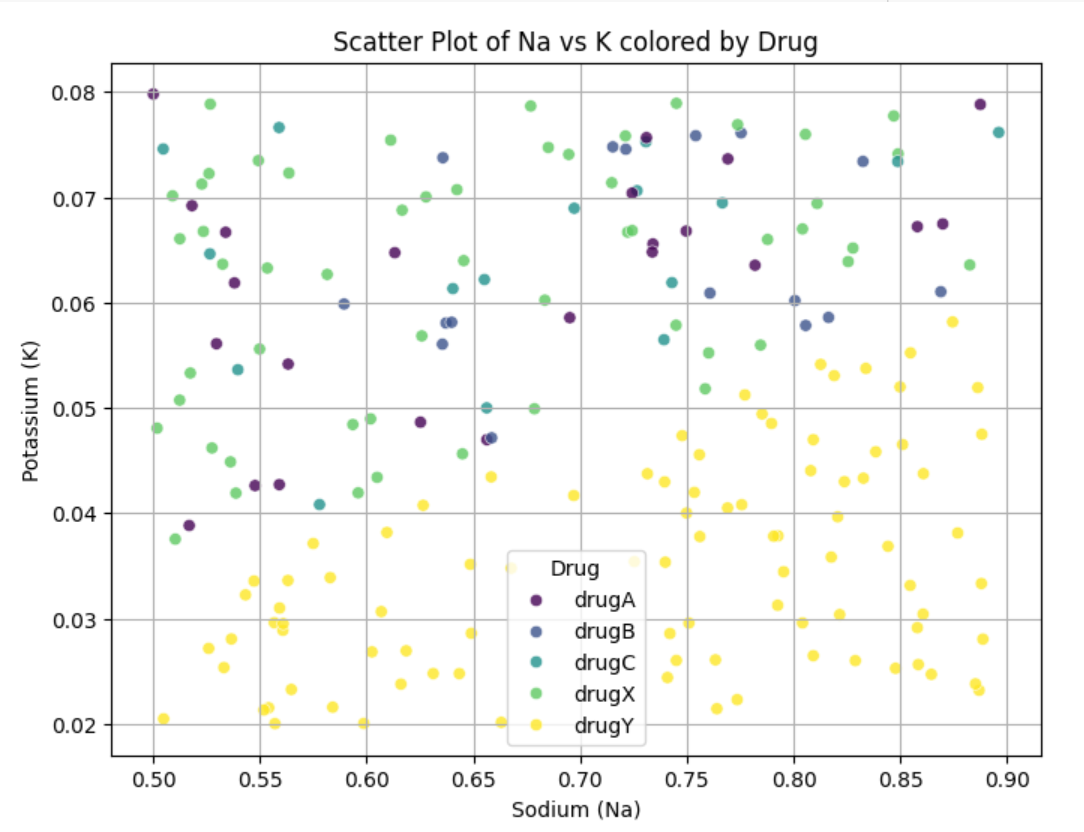
scatter = sns.scatterplot(x='Na', y='K', hue='Drug', data=df, palette='viridis', alpha=0.8)
plt.title('Scatter Plot of Na vs K colored by Drug')
plt.xlabel('Sodium (Na)')
plt.ylabel('Potassium (K)')
plt.grid(True)

# Update legend labels
handles, labels = scatter.get_legend_handles_labels()
scatter.legend(handles, [class_names_full[int(label)] for label in labels], title='Drug')

plt.show()
Na,KとdrugYとの関係には相関がありそう(Na/K比に注目)
新たな特徴量の作成と可視化
# 各データについてNa/K比を計算し、新しい列 Na/K Ratio に追加
df['Na/K Ratio'] = df['Na'] / df['K']

# Drugのカラム名を数値から元に戻す
df['Drug'] = df['Drug'].map(class_names_full)

# Na/K 比率の分布を視覚化
plt.figure(figsize=(8, 6))
sns.boxplot(x='Drug', y='Na/K Ratio', data=df, color='skyblue')
plt.title('Na/K Ratio by Drug')
plt.xlabel('Drug')
plt.ylabel('Na/K Ratio')
plt.show()

# drugYとその他のdrug間で Na/K比の平均に有意差があるかを検定(t検定)
from scipy.stats import ttest_ind

drugY_ratio = df[df['Drug'] == 'drugY']['Na/K Ratio']
other_drugs_ratio = df[df['Drug'] != 'drugY']['Na/K Ratio']

# 有意水準
alpha = 0.05

t_statistic, p_value = ttest_ind(drugY_ratio, other_drugs_ratio)

print(f'T-test: t-statistic = {t_statistic}, p-value = {p_value}')
# 判定
if p_value < alpha:
    print("Statistically significant")#有意差あり
else:
    print("Not statistically significant")#有意差なし
drugYとその他のdrug間で Na/K比の平均に有意差あり
import numpy as np
import warnings

# FutureWarning を無効化(新しいバージョンで発生する可能のある警告を無視)
warnings.simplefilter(action='ignore', category=FutureWarning)

# Drug列がdrugYの行のみをフィルタリングし、新しいDataFrame`drugY_df`に保存
drugY_df = df[df['Drug'] == 'drugY'].copy()  # 元のDataFrameを変更しないようにコピーを作成

# drugYのNa/K比の分布を可視化
plt.figure(figsize=(8, 6))
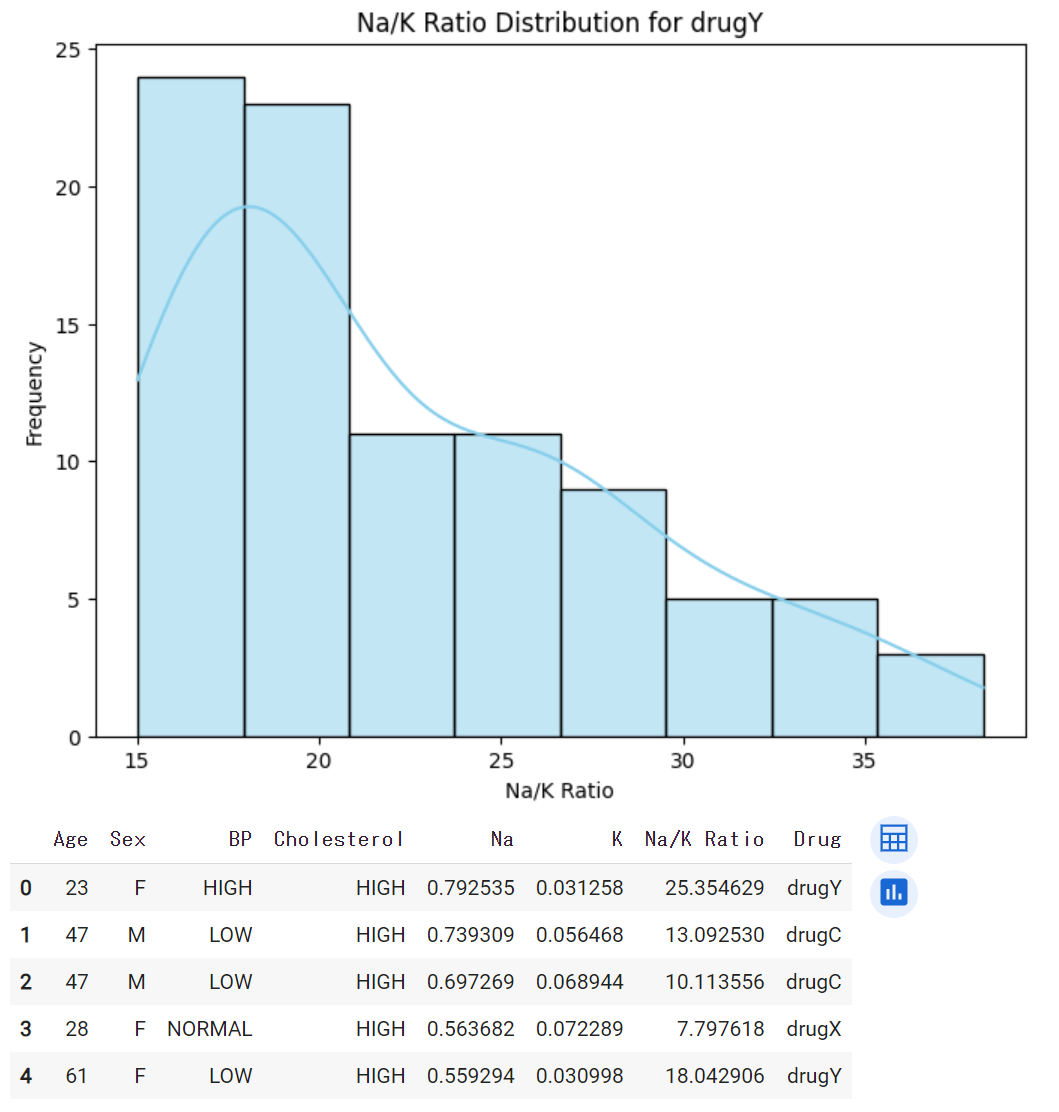
sns.histplot(drugY_df['Na/K Ratio'], kde=True, color='skyblue')
plt.title('Na/K Ratio Distribution for drugY')
plt.xlabel('Na/K Ratio')
plt.ylabel('Frequency')
plt.show()

# Drug列を最終行に移動
drug_column = df.pop('Drug')#Drug列を切り取り
df['Drug'] = drug_column#新たな列として追加

# 先頭5行を表示
display(df.head())
数値データのカテゴリカル変数化
from sklearn.preprocessing import OrdinalEncoder, LabelEncoder

# カテゴリカルデータとそのクラスの定義
sex_classes = ['F', 'M']
bp_classes = ['LOW', 'NORMAL', 'HIGH']
cholesterol_classes = ['NORMAL', 'HIGH']
drug_classes = ['drugA', 'drugB', 'drugC', 'drugX', 'drugY']

# Sex,BP,Cholesterolを数値データに変換
ordinal_encoder = OrdinalEncoder(categories=[sex_classes, bp_classes, cholesterol_classes])
df[['Sex', 'BP', 'Cholesterol']] = ordinal_encoder.fit_transform(df[['Sex', 'BP', 'Cholesterol']])

# ターゲット変数Drugを数値に変換
label_encoder = LabelEncoder()
df['Drug'] = label_encoder.fit_transform(df['Drug'])

# DataFrameの確認
display(df.head())
まとめ
- SexとDrugは互いに独立
- BP,Cholestelol,K,Na/K RatioとDrugとの間に相関あり
Sexを削除したデータセットでモデルの学習を行う
(モデル構築・予測編はこちら)
