背景
ユニットテストをjestで用意しているが、コードに対してどれくらいカバーできているか不透明であった。
(現在のテストコードがソースに対して充実しているか把握できていない。)
(カバーすべき対象が把握できていない。)
⇒
パイプラインでユニットテストを実施しているので、そのタイミングでカバレッジ(テストの網羅率)を出力して、定期的にチェックする。
カバレッジの出力方法(jest)
jestの設定ファイルを修正し、カバレッジ出力先を指定する
jest.config.jsに下記設定を追加する。
jest.config.js
// カバレッジ取得するか否か
  collectCoverage: true,

// The directory where Jest should output its coverage files
// カバレッジ出力先
  coverageDirectory: 'coverage',

// A list of reporter names that Jest uses when writing coverage reports
// レポータ名
  coverageReporters: [
    'html', //開発者ローカルで確認用
    'cobertura' //CIパイプラインで確認用
    // "json",
    // "text",
    // "lcov",
    // "clover"
  ],
test実施時に、設定ファイルを読み込んで実施するようにオプションを加える
packages.jsonのscriptを下記のように設定する。
(設定ファイルの場所は任意)
package.json
  "scripts": {
    "test": "jest --config test/unit/jest.config.js --reporters=default",
  },
ここまでの設定で、npm run testを実行すればtest/unit/coverageにカバレッジが生成されるようになります。
yaml上で、カバレッジ出力タスクを追加する
pipeline.ymlに、ユニットテスト後にPublishCodeCoverageResults@1タスクを追加する。
pipelien.yml
### ユニットテスト
- script: |
    npm run test
  displayName: 'ユニットテスト'
  workingDirectory:  '$(System.DefaultWorkingDirectory)'

### Coverageの取得
- task: PublishCodeCoverageResults@1
  displayName: 'Coverageの取得'
  inputs:
    codeCoverageTool: Cobertura
    summaryFileLocation: $(System.DefaultWorkingDirectory)/test/unit/coverage/cobertura-coverage.xml
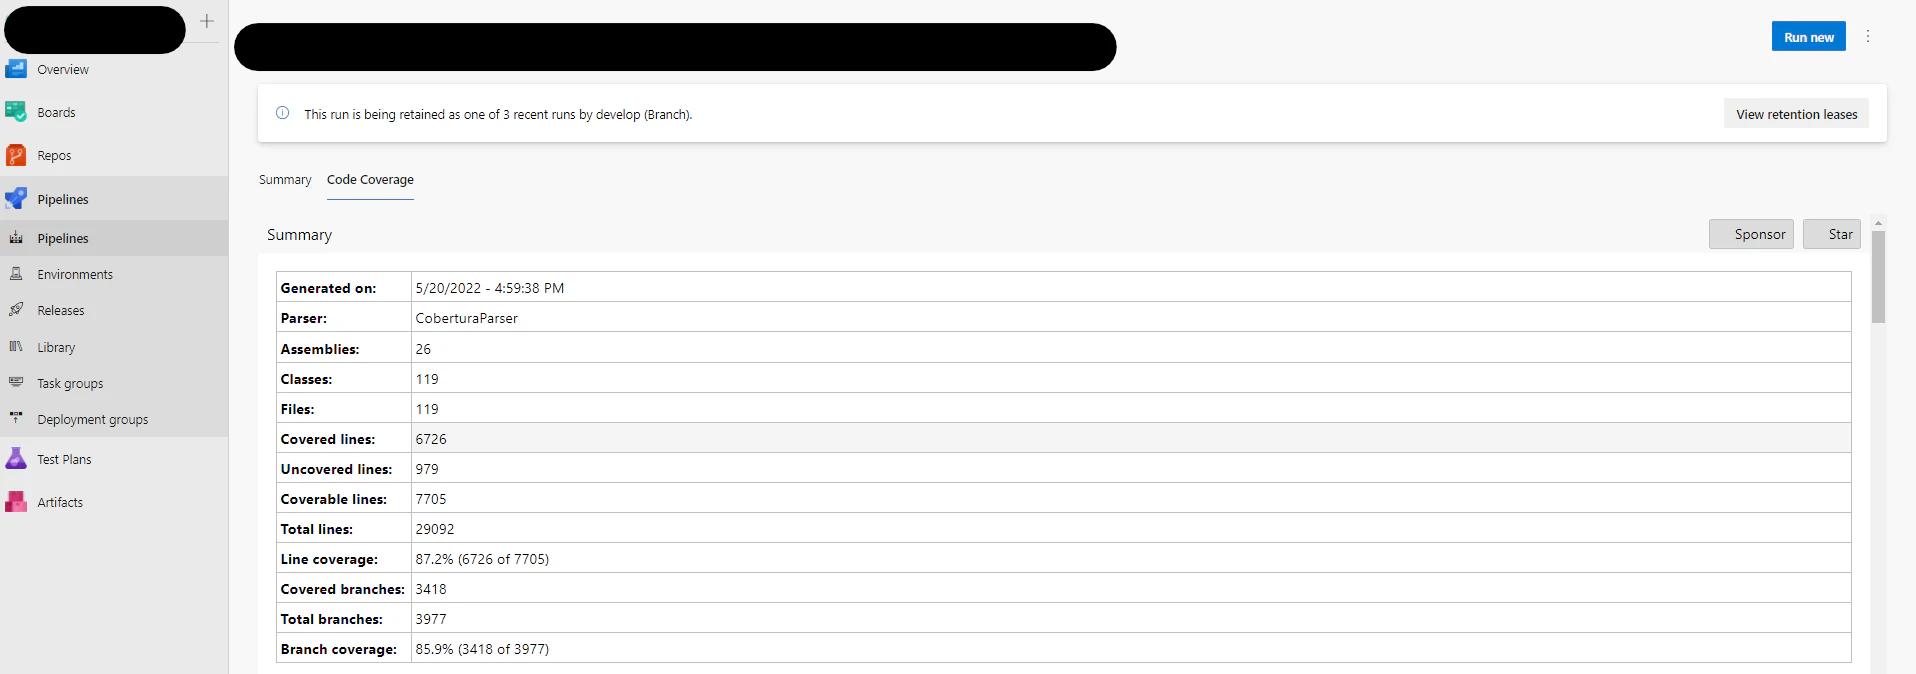
これで、パイプラインの実行結果画面から、カバレッジが参照できるようになります。
パイプラインの実行結果画面に、「Summary」の隣に「Code Coverage」タブが現れる。
補足
カバレッジは100%目指せばいいものでもないらしい。。