Source
Introduction
Anomaly detection is a binary classification between the normal and the anomalous classes. While this problem can be tackled easily through the conventional method of learning from both normal and abnormal data, it is impractical for real world use cases as there is often a lack of anomaly data. Therefore, the general approach is to use unsupervised learning on normal data only.
One popular way to perform anomaly detection and localization is to use generative methods such as AutoEncoders (AE), Variational AutoEncoders (VAE) or Generative AutoEncoders (GAN), where areas of the generated image that differ from the original image is considered an anomaly. However, all of these methods require cumbersome deep neural network training and sometimes they may yield good reconstruction results even for anomalous images.
While there have been other approaches such as SPADE that avoids training a deep neural network, it employs K-nearest-neighbour (KNN) on entire training dataset at test time, which causes long inference time.
The proposed method introduced in this paper uses a pre-trained CNN for embedding extraction while taking into consideration of the correlations between different semantic levels of the pre-trained CNN, yielding state of the art result for anomaly detection.
Patch Distribution Modelling (PaDiM)
Embedding extraction
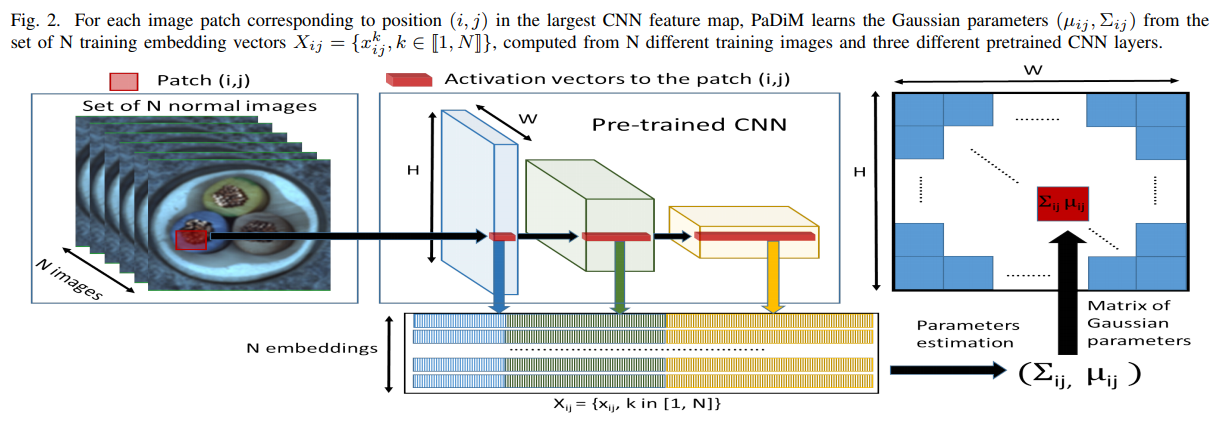
Activation vectors from different layers of the CNN are concatenated to get the embedding vectors that contains both fine-grained and global context regarding the image.
An input image is divided into patches that are sized $W$x$H$, where $W$x$H$ is the resolution of the largest activation map (output size of the 1st layer of the CNN). Each of these patches is associated to an embedding vector $x_{ij}$ computed as described above.
As these generated patch embedding vectors may contain redundant information, an ablation study was performed and it was discovered that randomly selecting few dimensions not only decrease the complexity of the model significantly, it is also more efficient than conducting dimension reduction through Principal Component Analysis (PCA).
Learning the normality
$X_{ij}$ is the total number of embedding vectors $x_{ij}$ gathered from $N$ normal images. It is under the assumption that $X_{ij}$ is generated by a multivariate Gaussian distribution $\mathcal{N}(\mu_{ij}, \Sigma_{ij})$ where $\mu_{ij}$ is the sample mean of $X_{ij}$, and $\Sigma_{ij}$ is the sample covariance which is obtained through the following equation:

where $\epsilon$ is a constant regularization term.
Inferencing
During inferencing, the Mahalanobis distance $M(x_{ij})$ is used to compute difference between the patch embedding vectors of a test image and the learnt distribution $\mathcal{N}(\mu_{ij}, \Sigma_{ij})$. It is calculated as follows:

High scores in the anomaly map $M$ indicate the location of anomalies, and the anomaly score of an image is interpreted as the maximum value of the anomaly map.
Result
Setup
Two metrics are used for model effectiveness evaluation. One is the Area Under the Receiver Operating Characteristic curve (AUROC), where the true positive rate is the percentage of pixels correctly classified as anomalous. Another metric is the per-region-overlap score (PRO-score), as it avoids the bias in favor of large anomalies present in AUROC. A high PRO-score indicates that both large and small anomalies are well-localized.
Two different datasets were used; MVTec AD and Shanghai Tec Campus. The images from MVTec AD are resized to 256x256 then center-cropped to 224x224, while STC images are resized to 256x256 only. Additionally, a modified version of MVTec AD named Rd-MVTec AD is also used, where random rotation and random crop is applied to both the train and test sets in order to test a model's robustness against non-aligned images.
Three different pre-trained CNN were tested to extract the embedding vectors; ResNet18, Wide ResNet-50-2 and EfficientNet-B5.
Effects of layers
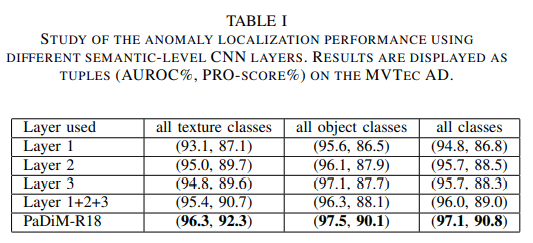
In general, the performance increases along with the level of semantic level information. Taking the correlations between different semantic levels into account also yields better result than simply summing the outputs (PaDiM-R18 vs Layer 1+2+3).
Dimension Reduction
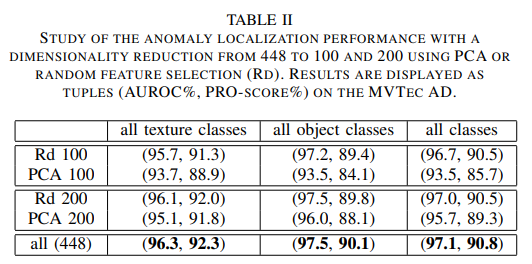
As mentioned earlier, the random dimensionality reduction (Rd) outperforms PCA in all areas. Reducing the embedding vector size has very little impact on the anomaly localization performance while greatly improves the time and space complexity of the algorithm.
Anomaly Detection
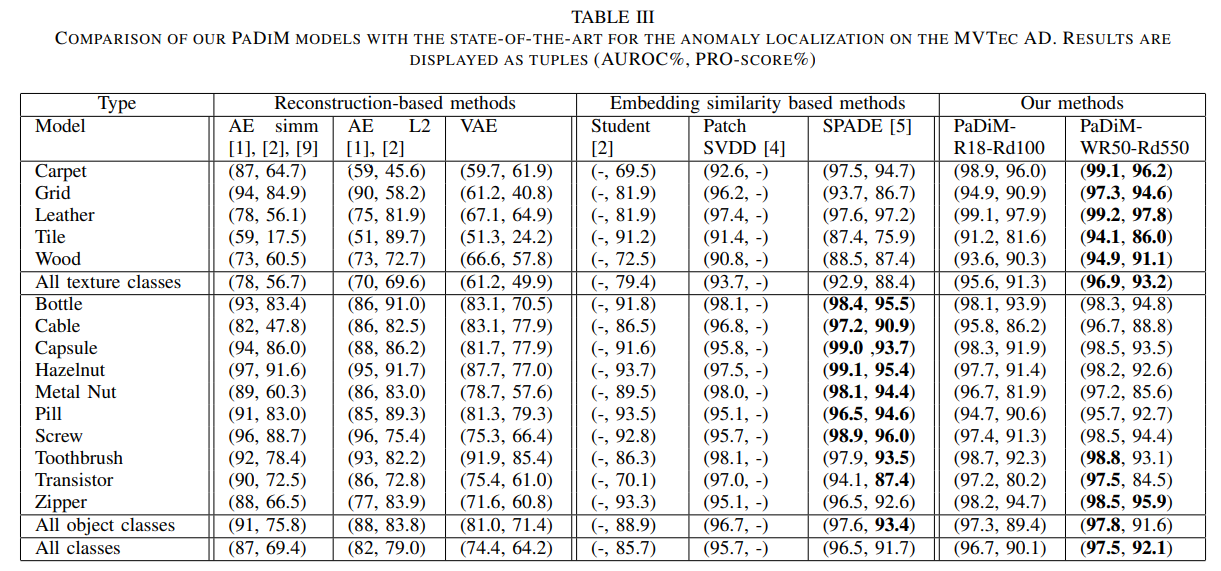
PaDim is superior at detecting defects in textured classes in MVTec AD, and it is also the best overall performing algorithm.
Similarly, it has the highest AUROC on the STC dataset.

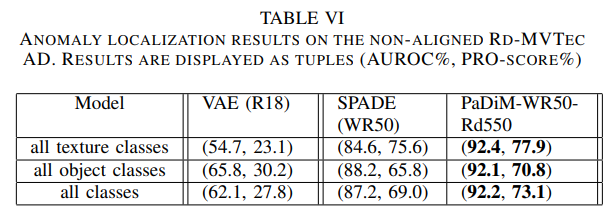
In addition, PaDiM is more robust to non-aligned images, as shown below.
Result Visualization
Time and Space Complexity
The inference time for PaDiM is almost on par with VAE, and significantly faster than SPADE as it does not need to perform KNN on the test image and training data.

The memory required by PaDiM is much lower than SPADE as it only keeps the pre-trained CNN and Gaussian parameters associated with each patch in memory.

Conclusion
PaDiM has achieve a new state of the art result on anomaly detection. However, it remains to be seen whether it can yield equivalent performance when there are multiple objects and/or defects in an image.
Another concern is the memory requirement when there is a large training data, both terms of image count and image resolution, as they need to be stored in order to to derive the Gaussian parameters.
