目的
月ごとに利用者数を折れ線グラフで表現したい。
使用するデータ
SIGNATEさんの練習問題として公開されている「レンタル自転車の利用者予測」 のtrain dataを使います。
データの構成
月を表す'mnth'と利用者数を表す'cnt'を使ってグラフを作ります。その前にデータを確認しましょう。
1月から12月まで数字が入っているか確認します
print(df['mnth'].value_counts())
データの件数と利用者数の件数(合計人数ではない)が一致するか確認します。
print(df['cnt'].count())
誤ったグラフの作り方
グラフを作るために
import matplotlib.pyplot as plt
を実行して、変数をそのまま投入します。
x = df['mnth']
y = df['cnt']
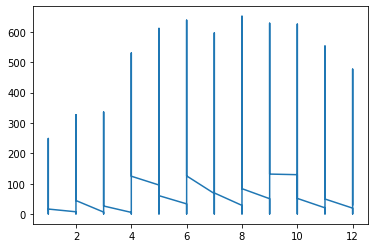
plt.plot(x,y)
困りました・・・
正しいグラフの作り方 - グルーピング
X軸に月を持ってきたいので、月を連続データではなくカテゴリーのような働き方をさせるために、1から12をそれぞれグループにします。
df2 = df.groupby('mnth').sum()
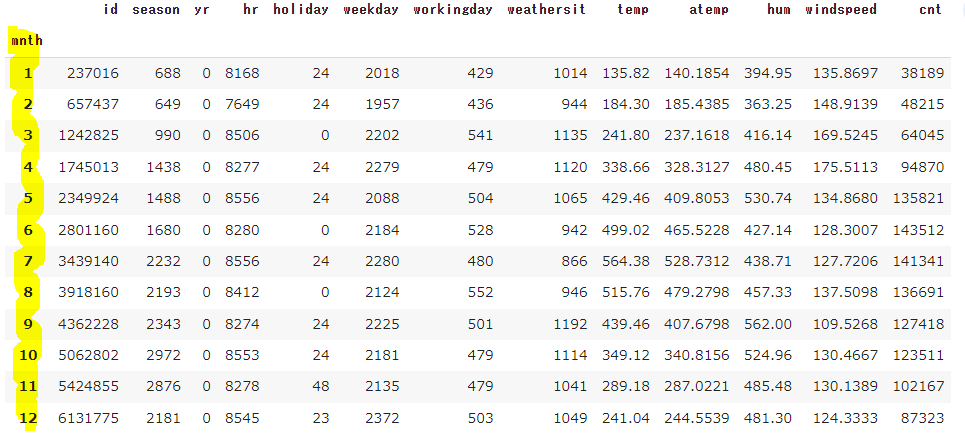
これを実行して1月から12月までをIndexに作ります。こんなイメージです。
表側に1から12まで並んでいます。'mnth'を月ごとに合算したことになっています。利用者数'cnt'も1月から12月まで合算されています。
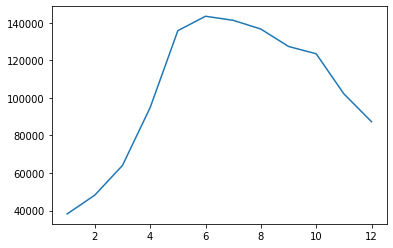
これでグラフを作成します。
import matplotlib.pyplot as plt

# monthをグルーピング(グルーピングしたmonthはindex)
df2 = df.groupby('mnth').sum()

x = df2.index #これがgroupbyした'mnth'です。
y = df2['cnt']
plt.plot(x,y)
まとめ
X軸で表現したデータが数値の時は、グルーピング(groupby)しましょう。
groupby('グルーピングしたい変数名')
そしてgroupbyの後に何をしたいのか書く事も必要です。今回はグルーピングして合計を出したいので
groupby('グルーピングしたい変数名').sum()
というように書きます。


