概要
Unsupervised learning:教師なし学習は重要。ここでやるのはクラスタリング。実際に機械学習で使われるデータは、値はあるが、正解ラベルがついていないことが多い。それらを分類して、ラベルを付けるのが、教師なし学習のクラスタリング。
そのほかの教師なし学習としては、次元削減がある。例えば下の図のように複雑なs字線上にある点があるとすると、このs字上の関数上にプロットすることで、X, Yの2次元を、その関数で表現できれば、1次元で表現できる。

内容
クラスタリングの具体例。映画の分類。katieの好きな映画がわかれば、その映画を見るように提案して、買ってもらえる。

図1
クラスタリングのメジャーな方法の一つはK-means法。
これからどのようなアルゴリズムなのか解説する。
K-means法

例えば上記のように、7点赤✖のデータがあってそれを2つのクラスに分けるタスクを考える。緑の✖はその中心。
①中心位置の設置→距離計算:Assign
最初は下記のようにランダムに2つのクラスの中心をおいてみる。(クラスが2つなのは人が指示する。これが自動でできたらねー)その後、各7点のデータと各2点の中心位置の距離を測定して、各データに対して一番近い中心位置をAssignする。下図では線で結んでいる。

②最適化:Optimize
直感的には、上記のように結んだ線をゴムだとおもって、どの位置で各中心位置が釣り合うかを考える。その釣り合う位置に中心を移動する。具体的にはつながっている各線のトータルの長さが最も短くなる一に中心を移動する。移動後が下記。

その後、①②を繰り返すと、図1のようになる。
直感的にわかるのは下記のサイトと紹介してくれている。
Visualizing K-Means Clustering
真ん中らへんの
How to pick the initial centroids?
のところ。
最初に、中心位置をどのように設定するか聞かれる。その後、データを選んで、Goをクリックすると中心位置が各ステップごとにどのように動くか見ることができる。
ここでわかるのは中心位置の初期値がいかに重要かということ。それによって結果が全く違ってくる。
Sklearn
sklearn : 2.3. ClusteringにK-means法も含めた、様々なアルゴリズムの種類とそのユースケース等が記載されているので、これを参考にすること。
K-means法では、一般的に調整すべきパラメーターが3つ
<調整すべきパラメーター>
n_clusters ・・・分けたいクラスタリングの数。デフォルトは8
max_iter・・・上記①assign、②optimizeをくりかえす最大回数。デフォルトは300
n_init・・・クラスタリングは最初に設定する中心位置で結果が変わってしまうので、中心初期位置を何度実施するか。デフォルトは10。
Mini-project
Enronデータのデータを使って行う。
sklearnのK-meansクラスタリングページ
sklearn.cluster.KMeansを参照して課題を行った。
Quiz20
コード全部はこちら
GitHub:ud120-projects/k_means/k_means_cluster.py
クラスタリングに使った特徴量は書き2つ
feature_1 = "salary"
feature_2 = "exercised_stock_options"
追加したところは下記
### cluster here; create predictions of the cluster labels
### for the data and store them to a list called pred
from sklearn.cluster import KMeans

kmeans = KMeans(n_clusters=2).fit(finance_features)
pred = kmeans.labels_
<出力>
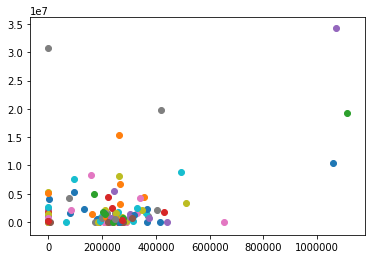

Quiz21
変えたところだけ抜粋。
第3の特徴量total_paymentsを加えた。
### the input features we want to use
### can be any key in the person-level dictionary (salary, director_fees, etc.)
feature_1 = "salary"
feature_2 = "exercised_stock_options"
feature_3 = "total_payments"#今回追加
poi  = "poi"
features_list = [poi, feature_1, feature_2, feature_3]#feature_3追加

data = featureFormat(data_dict, features_list )
poi, finance_features = targetFeatureSplit( data )

### in the "clustering with 3 features" part of the mini-project,
### you'll want to change this line to
### for f1, f2, _ in finance_features:
### (as it's currently written, the line below assumes 2 features)

for f1, f2, f3 in finance_features:#f3追加
    plt.scatter( f1, f2 )
plt.show()
<出力>


薄い青色のデータが5個から1個に減った。
ちなみにpredの中身は0か1の値が入っている。2枚目の散布図に出てくるように、1つのデータだけ1だった。total_paymentsの特徴量を加えることで、この変化が起こった。
次のレッスン:Feature scalingの準備
Quiz22, 23
feature scalingとは、クラスタリングや回帰で、それぞれの特徴量のレンジを0~1に合わせること。
そのために、まずはexercised_stock_options, salaryの特徴量の最小値:min, と最大値:maxを計算する。特徴量を0~1に調整することで、分類結果も変わってくる。
## Quiz 22: Stock Option Range
name_list = data_dict.keys()
serch_feature = "exercised_stock_options"
list_ex_st_op = []

for v in name_list:
    if data_dict[v][serch_feature] != "NaN":
        list_ex_st_op.append(data_dict[v][serch_feature])

print(list_ex_st_op)
print("Max_stock:"+str(max(list_ex_st_op)))
print("Min_stock:"+str(min(list_ex_st_op)))

## Quiz22 ends

## Quiz 23: Salary Range
serch_feature = "salary"
list_sal = []

for v in name_list:
    if data_dict[v][serch_feature] != "NaN":
        list_sal.append(data_dict[v][serch_feature])

print(list_sal)
print("Max_sal:"+str(max(list_sal)))
print("Min_sal:"+str(min(list_sal)))
<出力>
Max_stock:34348384
Min_stock:3285
Max_sal:1111258
Min_sal:477
ちなみに、2つの特徴量で、feature scalingありでやると下図のような出力になるみたい。

Quiz20のクラスタリング結果の図は使っている特徴量は同じ。だけどfeature scalingがない。今回はある。チェックが入っている部分がfeature scalingの結果、POIとして分類されたデータ。feature scaling有り無しで結果が変わってくることがわかる。
詳しくは次のlesson10で!
感想
大まかにどのようにコードを書けばクラスタリングができるのか分かった。feature scaling大事だね。何となくアルゴリズムの原理も理解できた気がする。
調べた英単語
deduce・・・v, 演繹(えんえき)する、推論する、推測する、
quadratic・・・adj, 二次の
blob・・・n, (インクなどの)しみ、(半固体の)小塊、ぼんやりした(形の)もの
ex)a blob of jelly.ゼリーの塊。
this blob of data.データの塊。
pedagogical・・・adj, 教育学の、教授法の
deceptive・・・adj, 人を欺(あざむ)くような、当てにならない
deceive・・・v, だます、欺(あざむ)く、思い違いをさせる