【目的】
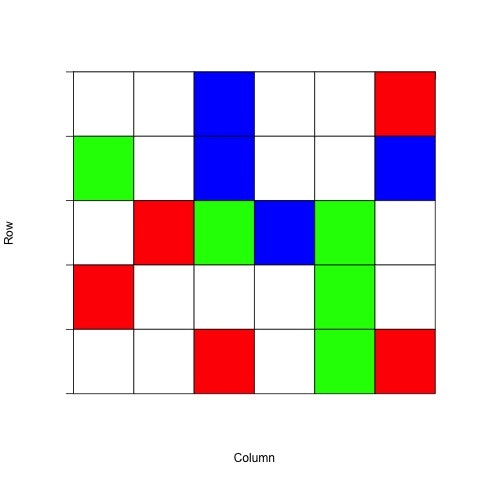
データファイルから行列を読み取り数値に応じて色分けして二次元格子上に表示する
【使用するもの】
R言語(draw_lattice.r)
データファイル(matrix.dat)
matrix.dat
0 0 2 0 0 3
1 0 2 0 0 2
0 3 1 2 1 0
3 0 0 0 1 0
0 0 3 0 1 3
これを二次元格子上に
0 は白、1 は緑、2 は青、3 は赤のように表示したいとします。
【手順】
draw_lattice.r
# ======= # Reading a file named "matrix.dat" =======
x <- read.table("matrix.dat")
# ===================================================

N <- 5  # Number of rows
M <- 6  # Number of columns

# ======= Plot axes =======
 plot(0:1, type="n",xlab="Column", ylab="Row",axes=F,xlim=c(0,M),ylim=c(N,0))
 axis(1, pos = 0,label=F)
 axis(2, pos = 0,label=F)
# ==========================

# ======= Paint eash site =======
for (i in 1:N) {
	for (j in 1:M) {
       if(x[i,j]==0){
       	  rect(j-1,i-1,j,i, col=rgb(1,1,1),border=rgb(0,0,0))  # col="white",border="black"
       }else if(x[i,j]==1){
       	  rect(j-1,i-1,j,i, col=rgb(0,1,0),border=rgb(0,0,0))  # col="green",border="black"
       }else if(x[i,j]==2){
       	  rect(j-1,i-1,j,i, col=rgb(0,0,1),border=rgb(0,0,0))  # col="blue",border="black"
	   }else{
       	  rect(j-1,i-1,j,i, col=rgb(1,0,0),border=rgb(0,0,0))  # col="red",border="black"
       }
     }
 }
# ================================

# ====== Generate a pdf file (if you need) ======
dev.copy(pdf, file="lattice.pdf")
 dev.off()
# =============================================
【実行結果】
