はじめに
授業のチーム開発で散布図を作ることがあり、そこの開発に携わっていたので、アウトプットしようと思いました。
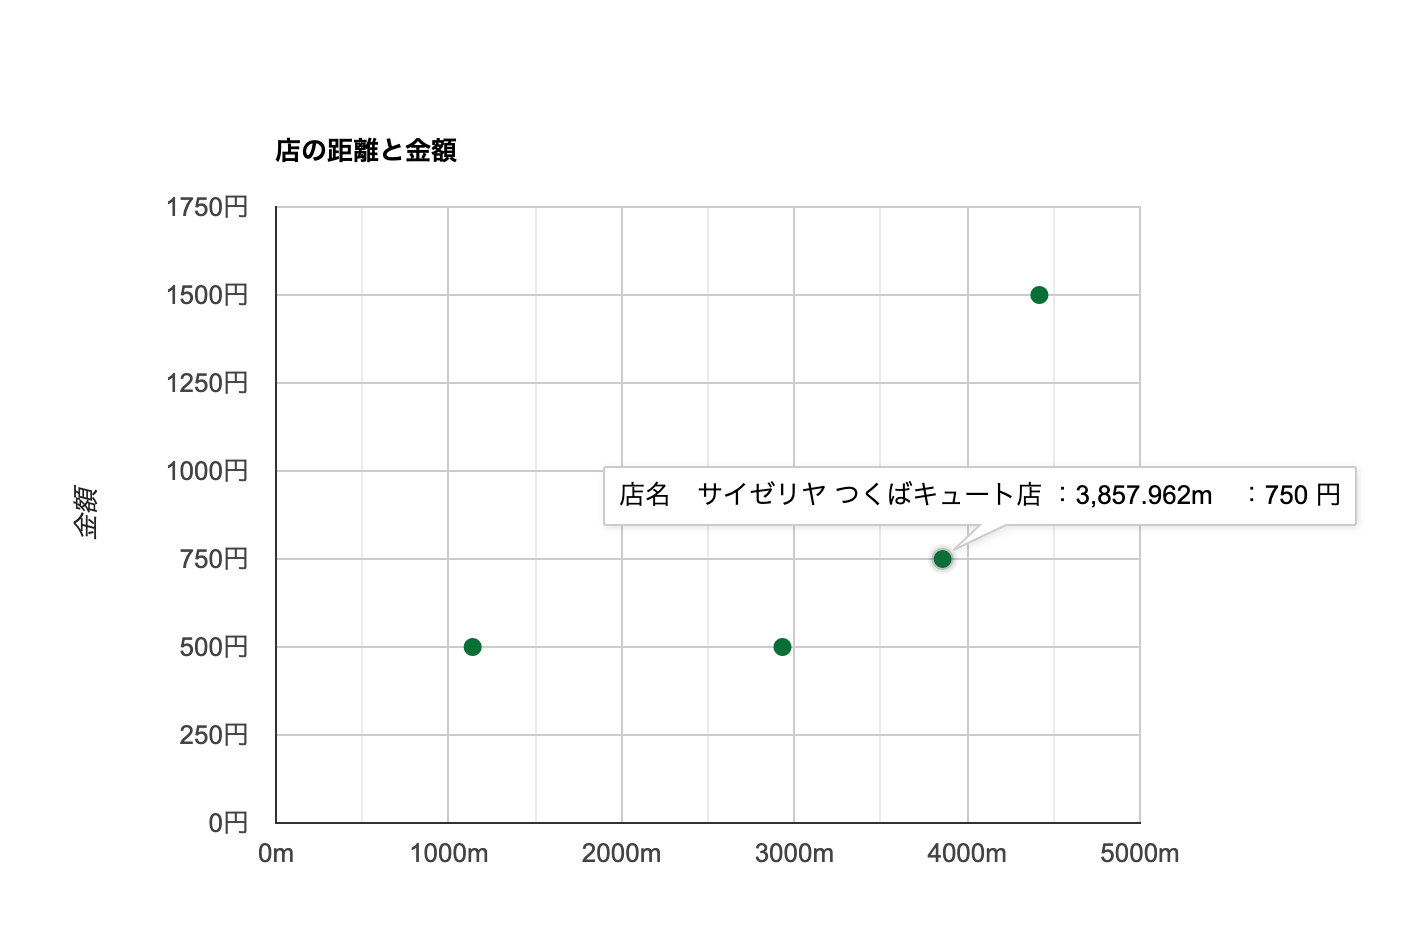
成果物
このように、散布図を作成することができました。
参考元
Google Charts (Scatter Charts)
また、散布図の元データとして、ぐるなびAPIから得たデータを利用しています。
ぐるなびAPI
※2021/1/15以降、新規利用ができなくなったようです
開発環境
エディタ:vscode
ソースコード全体
   <div id="target" class="box" style="width: 700px; height: 500px;"></div>

    <script src="https://www.gstatic.com/charts/loader.js"></script>

    <!-- targetタグのdivに散布図を挿入-->
    <script src="js/googleScatter.js"></script>
const drawScatter = (result, userLatlng) => {
  google.charts.load('current', { 'packages': ['corechart'] });
  google.charts.setOnLoadCallback(drawChart);

  var mapLatlng = [
  ]

  function drawChart() {
    var data = new google.visualization.DataTable();

    // [距離、金額、店名]のデータテーブルを作成
    data.addColumn('number', '距離');
    data.addColumn('number', '金額');
    data.addColumn({ type: 'string', role: 'tooltip' });

    // ぐるなびAPIから情報を取得し、行を追加
    result.rest.map(item => {
      var latlng = new google.maps.LatLng(item.latitude, item.longitude);
      mapLatlng.push([item.latitude, item.longitude])
      var distance = google.maps.geometry.spherical.computeDistanceBetween(userLatlng, latlng);
      data.addRow([distance, item.budget, item.name]);
    });

    // mouseOnの時に表示される吹き出しを調整
    var formatter = new google.visualization.PatternFormat('店名 {2}  :{0}m :{1} 円 ');
    formatter.format(data, [0, 1, 2], 2);

    // 実際の散布図の設定
    var options = {
      title: '店の距離と金額',
      hAxis: { title: '距離', format: '###m', minValue: 0, maxValue: 15 },
      vAxis: { title: '金額', format: '###円', minValue: 0, maxValue: 15 },
      legend: 'none'
    };

    // コンテナに散布図を挿入
    var chart = new google.visualization.ScatterChart(document.getElementById('target'));

    // 散布図の店が押された時の処理を記入
    google.visualization.events.addListener(chart, 'select', function () {
      var selection = chart.getSelection();
      // console.log(selection[0].row);
      map.panTo(new google.maps.LatLng(mapLatlng[selection[0].row][0], mapLatlng[selection[0].row][1]))
    });

    chart.draw(data, options);
  }
}
index.htmlの中身
- 散布図の挿入元となるコンテナを用意
- Google Chartsの利用の宣言
- googleScatter.jsを呼び出す
をしています。
googleScatter.jsの中身
1. 散布図のデータの元となる表の構造を記述
    var data = new google.visualization.DataTable();

    // [距離、金額、店名]のデータテーブルを作成
    data.addColumn('number', '距離');
    data.addColumn('number', '金額');
    data.addColumn({ type: 'string', role: 'tooltip' });
2. 表にデータを入れていく
    // ぐるなびAPIから情報を取得し、行を追加
    result.rest.map(item => {
      var latlng = new google.maps.LatLng(item.latitude, item.longitude);
      mapLatlng.push([item.latitude, item.longitude])
      var distance = google.maps.geometry.spherical.computeDistanceBetween(userLatlng, latlng);
      data.addRow([distance, item.budget, item.name]);
    });
3. 散布図のプロパティを設定
// mouseOnの時に表示される吹き出しを調整
    var formatter = new google.visualization.PatternFormat('店名 {2}  :{0}m :{1} 円 ');
    formatter.format(data, [0, 1, 2], 2);

    // 実際の散布図の設定
    var options = {
      title: '店の距離と金額',
      hAxis: { title: '距離', format: '###m', minValue: 0, maxValue: 15 },
      vAxis: { title: '金額', format: '###円', minValue: 0, maxValue: 15 },
      legend: 'none'
    };
formatterの部分では、{0}{1}{2}がそれぞれ表しているのは、表の[列番号-1]です。
つまり今回なら、
{0} = 距離
{1} = 金額
{2} = 店名
optionsの部分では、散布図の「タイトル、横軸、縦軸」などを設定します。
また、表の1列目がhAxisの要素、2列目がvAxisの要素になります。
4. コンテナに作成したchartを埋め込む
    // コンテナに散布図を挿入
    var chart = new google.visualization.ScatterChart(document.getElementById('target'));
5. 散布図の点がクリックされた時の処理を記述
    // 散布図の店が押された時の処理を記入
    google.visualization.events.addListener(chart, 'select', function () {
      var selection = chart.getSelection();
      // console.log(selection[0].row);
      map.panTo(new google.maps.LatLng(mapLatlng[selection[0].row][0], mapLatlng[selection[0].row][1]))
    });
引数に「select」を渡すことで、散布図の点がクリックされた時に動くようになっています。
また、変数のselectionでは表のindex部分を参照しています。
6. chartの描画
chart.draw(data, options);
反省点
-
変数の宣言部分の順番がわかりづらい
- targetにchartを入れるというところは、もっと最初の方に記述しておくべき
- index.htmlのjavascriptを呼び出すところがぐちゃぐちゃ
-
ソースコードの説明の仕方が下手くそ
最後に
今回は、Qiita初投稿でしたが、ソースコードの説明を記述するのがとても難しいということがわかりました。
もう少し、他の投稿者様の書き方を参考にしていきたいと思います。
