AlphaFold 2.3.0がリリースされました。追加された仕様の詳細はインストール記事の追記に書いております。
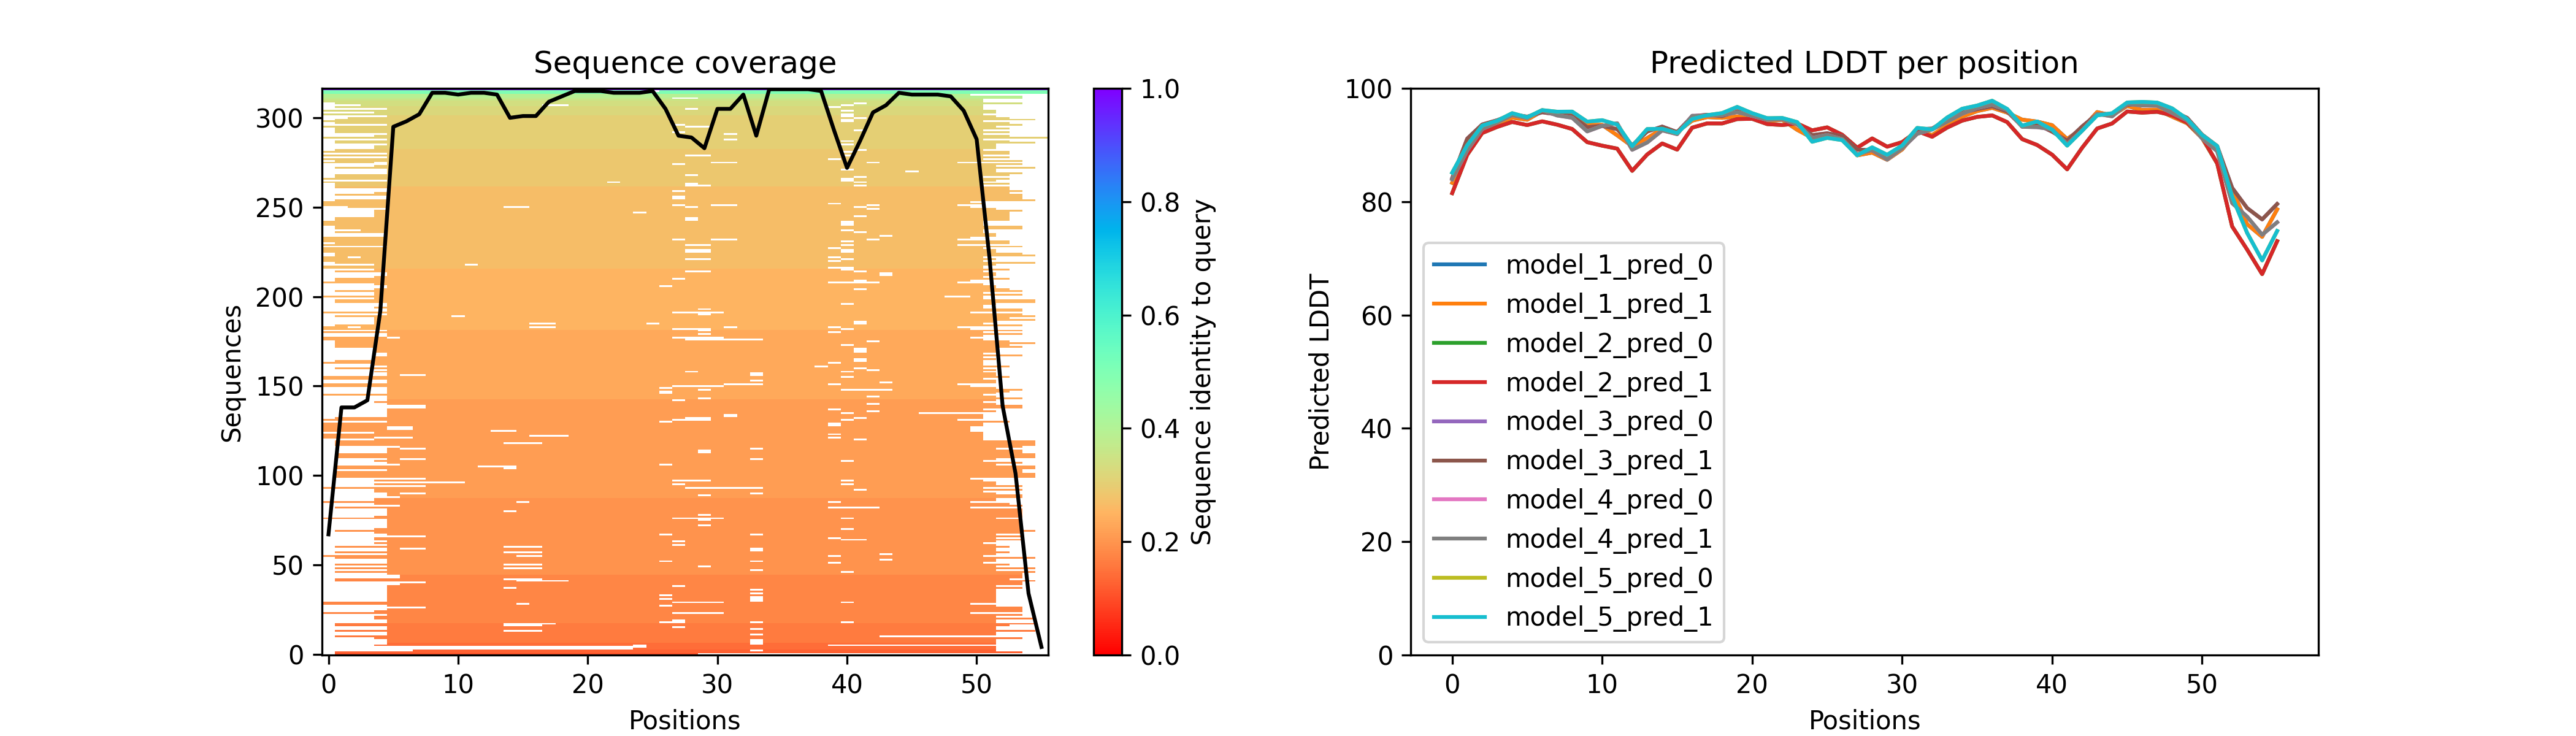
ColabFoldもそのうち2.3.0仕様にアップデートされると思いますが、ColabFoldの1つの特長として、MSA、plDDT、Predicted Aligned Errorの図が自動的に作成されて保存されるというものがあります。あれはオリジナルのAlphaFold2の出力する結果のファイルの一部にあるfeatures.pklやresult_model_[1-5]_ptm_pred_[0-9].pkl(多量体予測の場合はresult_model_[1-5]_multimer_v3_pred_[0-9].pkl)のファイルからデータを読み取り、それを画像に変換しています。
一部の人から「オリジナルのAlphaFoldの出力ファイルからあの画像を生成するスクリプトが欲しい」と尋ねられていたので、それを実行するPythonスクリプトを紹介します。
画像生成スクリプト
ColabFoldのコードと https://github.com/jasperzuallaert/VIBFold/blob/main/visualize_alphafold_results.py を参考に2.3.0以降にも対応できるよう作成しています。スクリプトaf2visualizer.pyは以下の通り。
#!/usr/bin/env python3
from matplotlib import pyplot as plt
from typing import Tuple
import argparse
import pickle
import matplotlib as mpl
import numpy as np
import re
import glob
mpl.use("Agg")
def get_max_num_per_model(model_names) -> int:
models = []
for i in model_names:
p = re.match(r"(.*)_([0-9]+).pkl", i)
assert p is not None
models.append(int(p.groups()[1]))
num_per_model = max(models) + 1
return num_per_model
def get_model_and_pred_nums(model) -> Tuple[int, int]:
p = re.match(r"(.*)result_model_([0-9])_(.*)_([0-9]+).pkl", model)
assert p is not None
model_num = int(p.groups()[1])
pred_num = int(p.groups()[3])
return model_num, pred_num
def get_pae_plddt(model):
out = {}
d = pickle.load(open(model, "rb"))
model_num, pred_num = get_model_and_pred_nums(model)
out[f"model_{model_num}_pred_{pred_num}"] = {
"plddt": d["plddt"],
"pae": d["predicted_aligned_error"],
}
return out
def generate_output_images(feature_dict, out_dir, name, model_names):
msa = feature_dict["msa"]
seqid = np.array(msa[0] == msa).mean(-1)
seqid_sort = seqid.argsort()
non_gaps = (msa != 21).astype(float)
non_gaps[non_gaps == 0] = np.nan
final = non_gaps[seqid_sort] * seqid[seqid_sort, None]
# MSA figure
plt.figure(figsize=(14, 4), dpi=300)
plt.subplot(1, 2, 1)
plt.title("Sequence coverage")
plt.imshow(
final,
interpolation="nearest",
aspect="auto",
cmap="rainbow_r",
vmin=0,
vmax=1,
origin="lower",
)
plt.plot((msa != 21).sum(0), color="black")
plt.xlim(-0.5, msa.shape[1] - 0.5)
plt.ylim(-0.5, msa.shape[0] - 0.5)
plt.colorbar(
label="Sequence identity to query",
)
plt.xlabel("Positions")
plt.ylabel("Sequences")
# pLDDT figure
plt.subplot(1, 2, 2)
plt.title("Predicted LDDT per position")
for model in sorted(model_names):
model_num, pred_num = get_model_and_pred_nums(model)
model_name = f"model_{model_num}_pred_{pred_num}"
plt.plot(get_pae_plddt(model)[model_name]["plddt"], label=model_name)
plt.legend()
plt.ylim(0, 100)
plt.ylabel("Predicted LDDT")
plt.xlabel("Positions")
plt.savefig(f"{out_dir}/{name+('_' if name else '')}coverage_pLDDT.png")
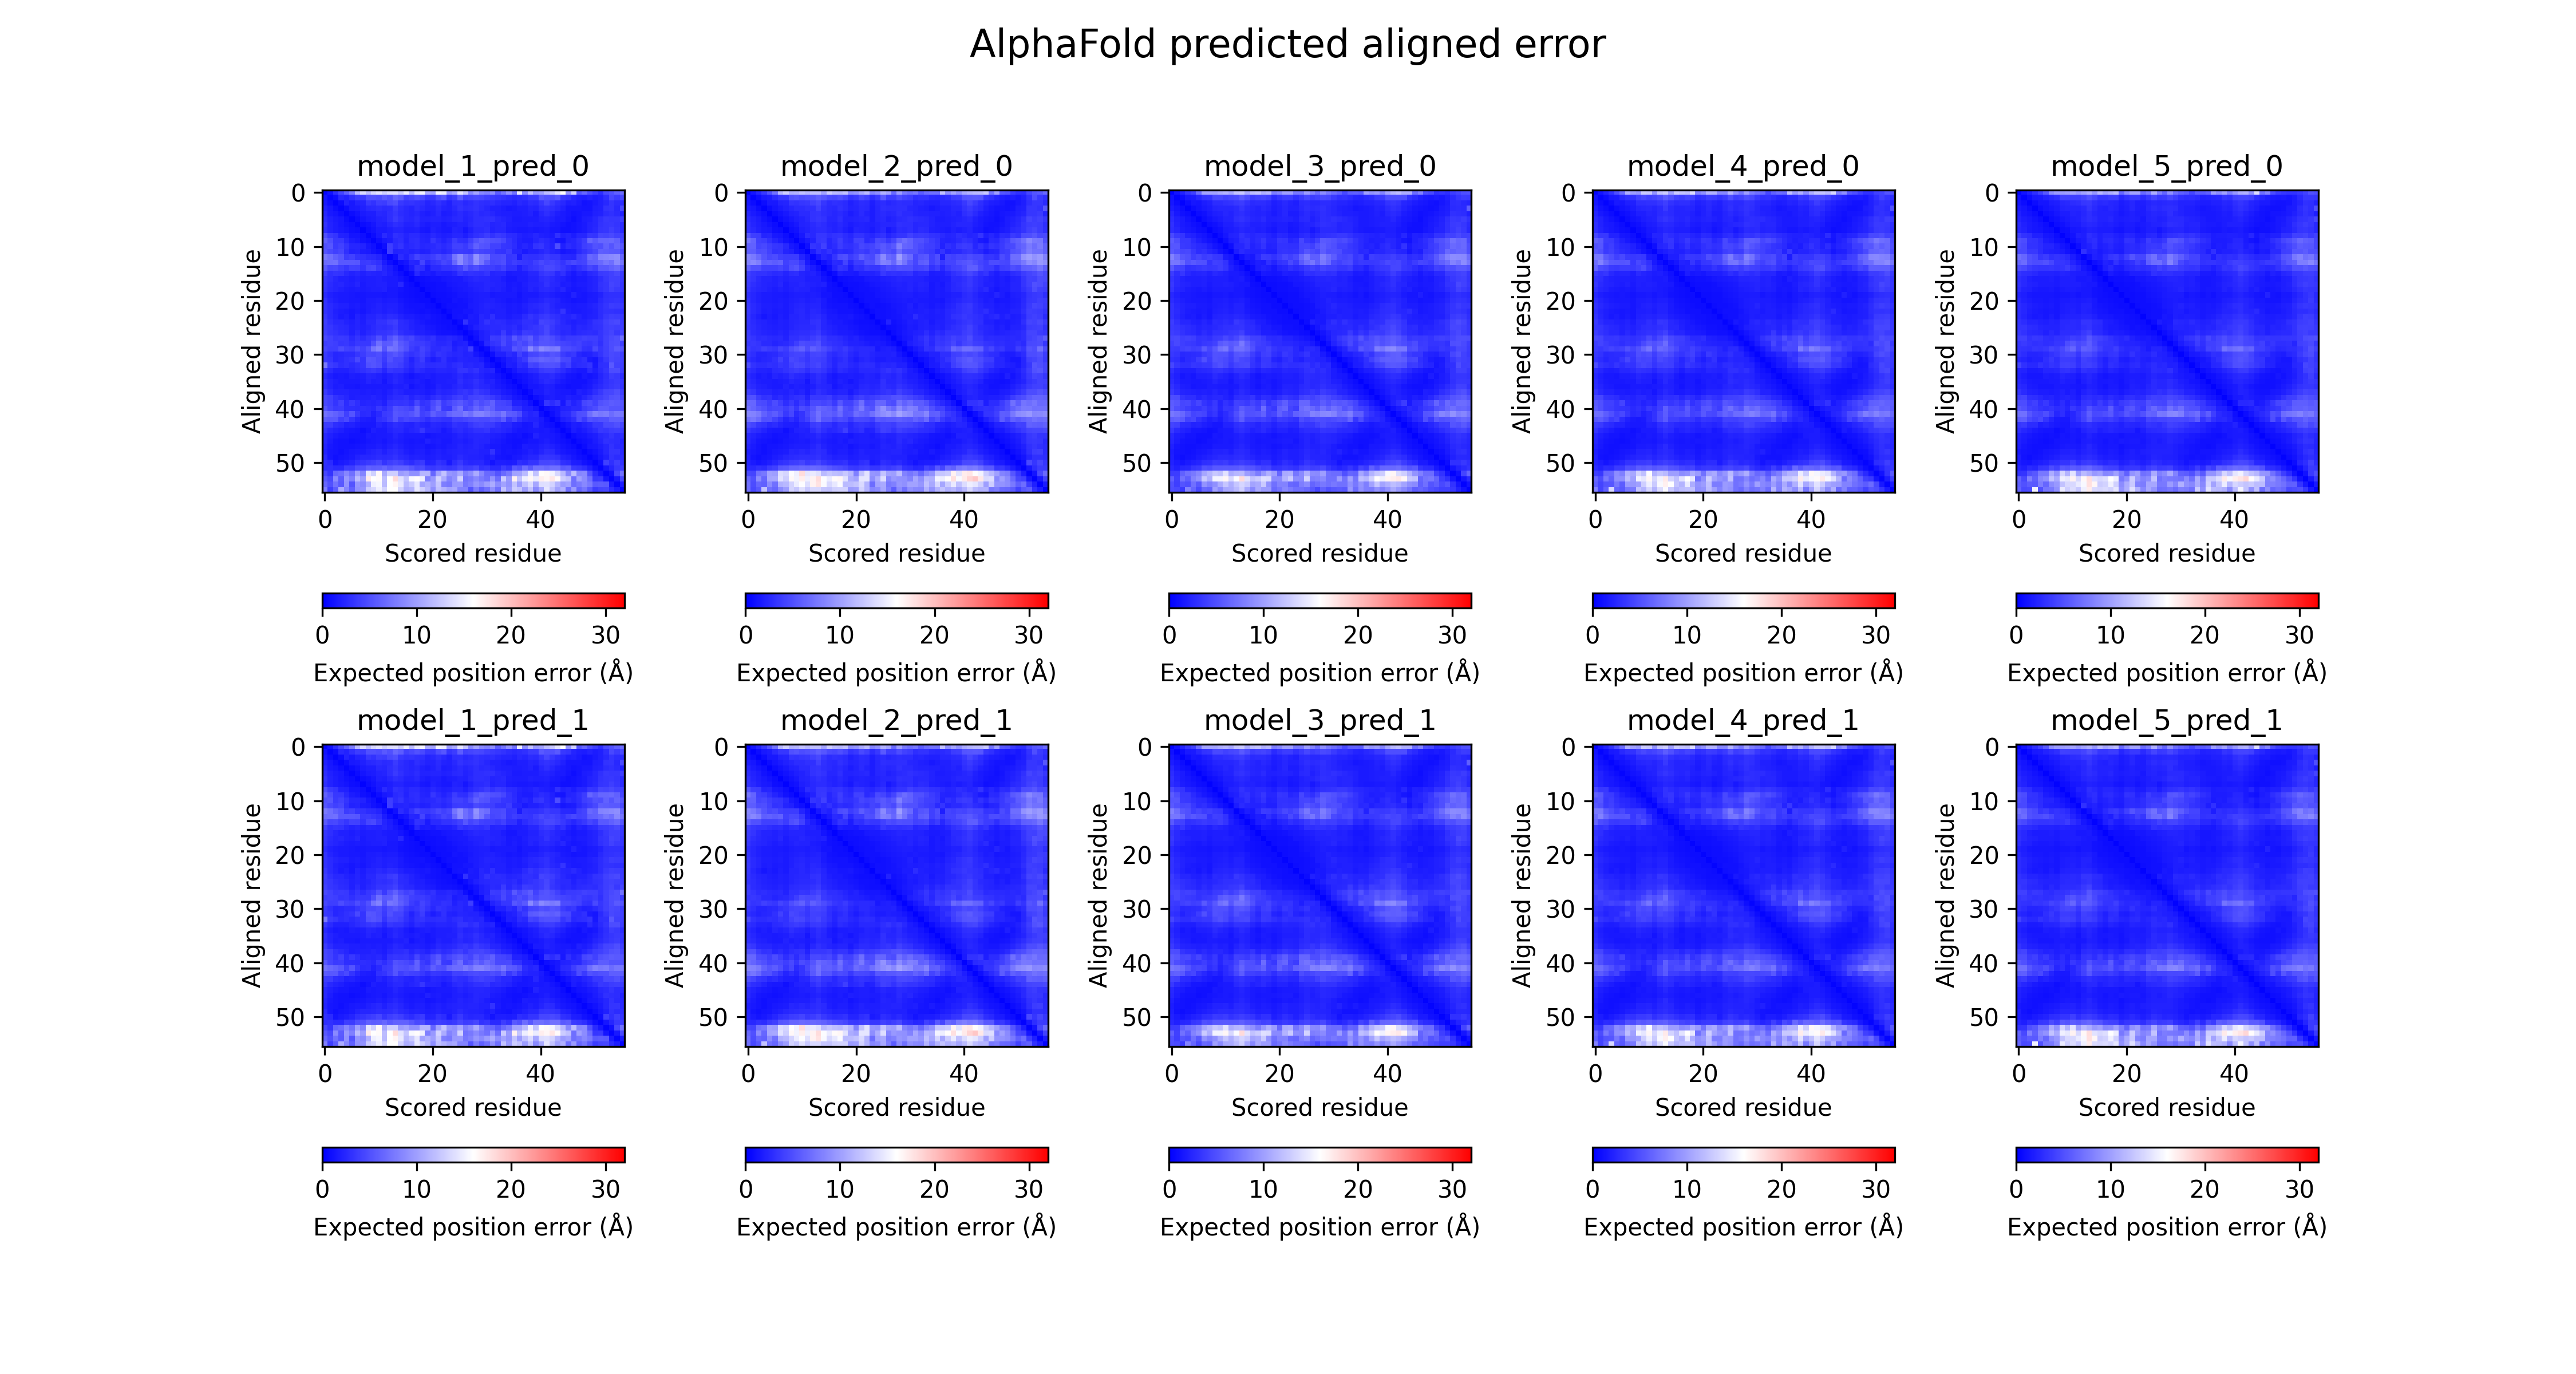
# PAE figures
num_models = 5
maxnum_per_model = get_max_num_per_model(model_names)
fig, axes = plt.subplots(
maxnum_per_model,
num_models,
figsize=(3 * num_models, 4 * maxnum_per_model),
dpi=300,
)
fig.subplots_adjust(hspace=0.1, wspace=0.4)
fig.suptitle("AlphaFold predicted aligned error", fontsize=16)
for model in model_names:
model_num, pred_num = get_model_and_pred_nums(model)
model_name = f"model_{model_num}_pred_{pred_num}"
if maxnum_per_model == 1:
axes[model_num - 1].set_xlabel("Scored residue")
axes[model_num - 1].set_ylabel("Aligned residue")
axes[model_num - 1].set_title(model_name)
fig.colorbar(
axes[model_num - 1].imshow(
get_pae_plddt(model)[model_name]["pae"],
label=model_name,
cmap="bwr",
vmin=0,
vmax=32,
),
ax=axes[model_num - 1],
orientation="horizontal",
label="Expected position error (Å)",
pad=0.2,
)
else:
axes[pred_num][model_num - 1].set_xlabel("Scored residue")
axes[pred_num][model_num - 1].set_ylabel("Aligned residue")
axes[pred_num][model_num - 1].set_title(model_name)
fig.colorbar(
axes[pred_num][model_num - 1].imshow(
get_pae_plddt(model)[model_name]["pae"],
label=model_name,
cmap="bwr",
vmin=0,
vmax=32,
),
ax=axes[pred_num][model_num - 1],
orientation="horizontal",
label="Expected position error (Å)",
pad=0.2,
)
plt.savefig(f"{out_dir}/{name+('_' if name else '')}PAE.png")
# Main
parser = argparse.ArgumentParser()
parser.add_argument(
"-i",
"--input_dir",
dest="input_dir",
help="Input directory containing 'feature.pkl' and 'result_model_[1-5]_*_pred_*.pkl' files generated by AlphaFold2.",
required=True,
)
parser.add_argument(
"-o",
"--output_dir",
dest="output_dir",
help="Output directory where resultant figures will be saved. "
"The default is the same as the input directory.",
)
parser.add_argument(
"-n", "--name", dest="name", default="", help="Prefix for the output figure files"
)
args = parser.parse_args()
feature_dict = pickle.load(open(f"{args.input_dir}/features.pkl", "rb"))
model_names = [
p for p in glob.glob(f"{args.input_dir}/result_model_[1-5]_*_pred_[0-9]*.pkl")
]
generate_output_images(
feature_dict,
args.output_dir if args.output_dir else args.input_dir,
args.name,
model_names,
)
2箇所あるcmap="bwr"の部分をcmap="Greens_r"にすると、Predicted Aligned ErrorがAlphaFold Databaseで表示されているようなカラーリングになります。
実行方法
上で紹介したPythonスクリプトを適当な場所にaf2visualizer.pyとして保存します。また、以下のライブラリが必要です。
$ python3 -m pip install numpy matplotlib jax==0.3.25 jaxlib==0.3.25
JAXとjaxlibは現在バージョン0.4以上が出ていますが、AlphaFold 2.3.0が利用しているのはバージョン0.3.25までなので、これを使った方が無難かもしれません(ver.0.4以上でも動くかもしれません)。
AlphaFold2の結果ファイルが存在するディレクトリ(例としてProteinXとします)を指定して以下のコマンドを実行します。
$ python3 af2visualizer.py -i ProteinX
これで以下のような画像が生成されます(カラーリングをcmap="Greens_r"にした場合)。
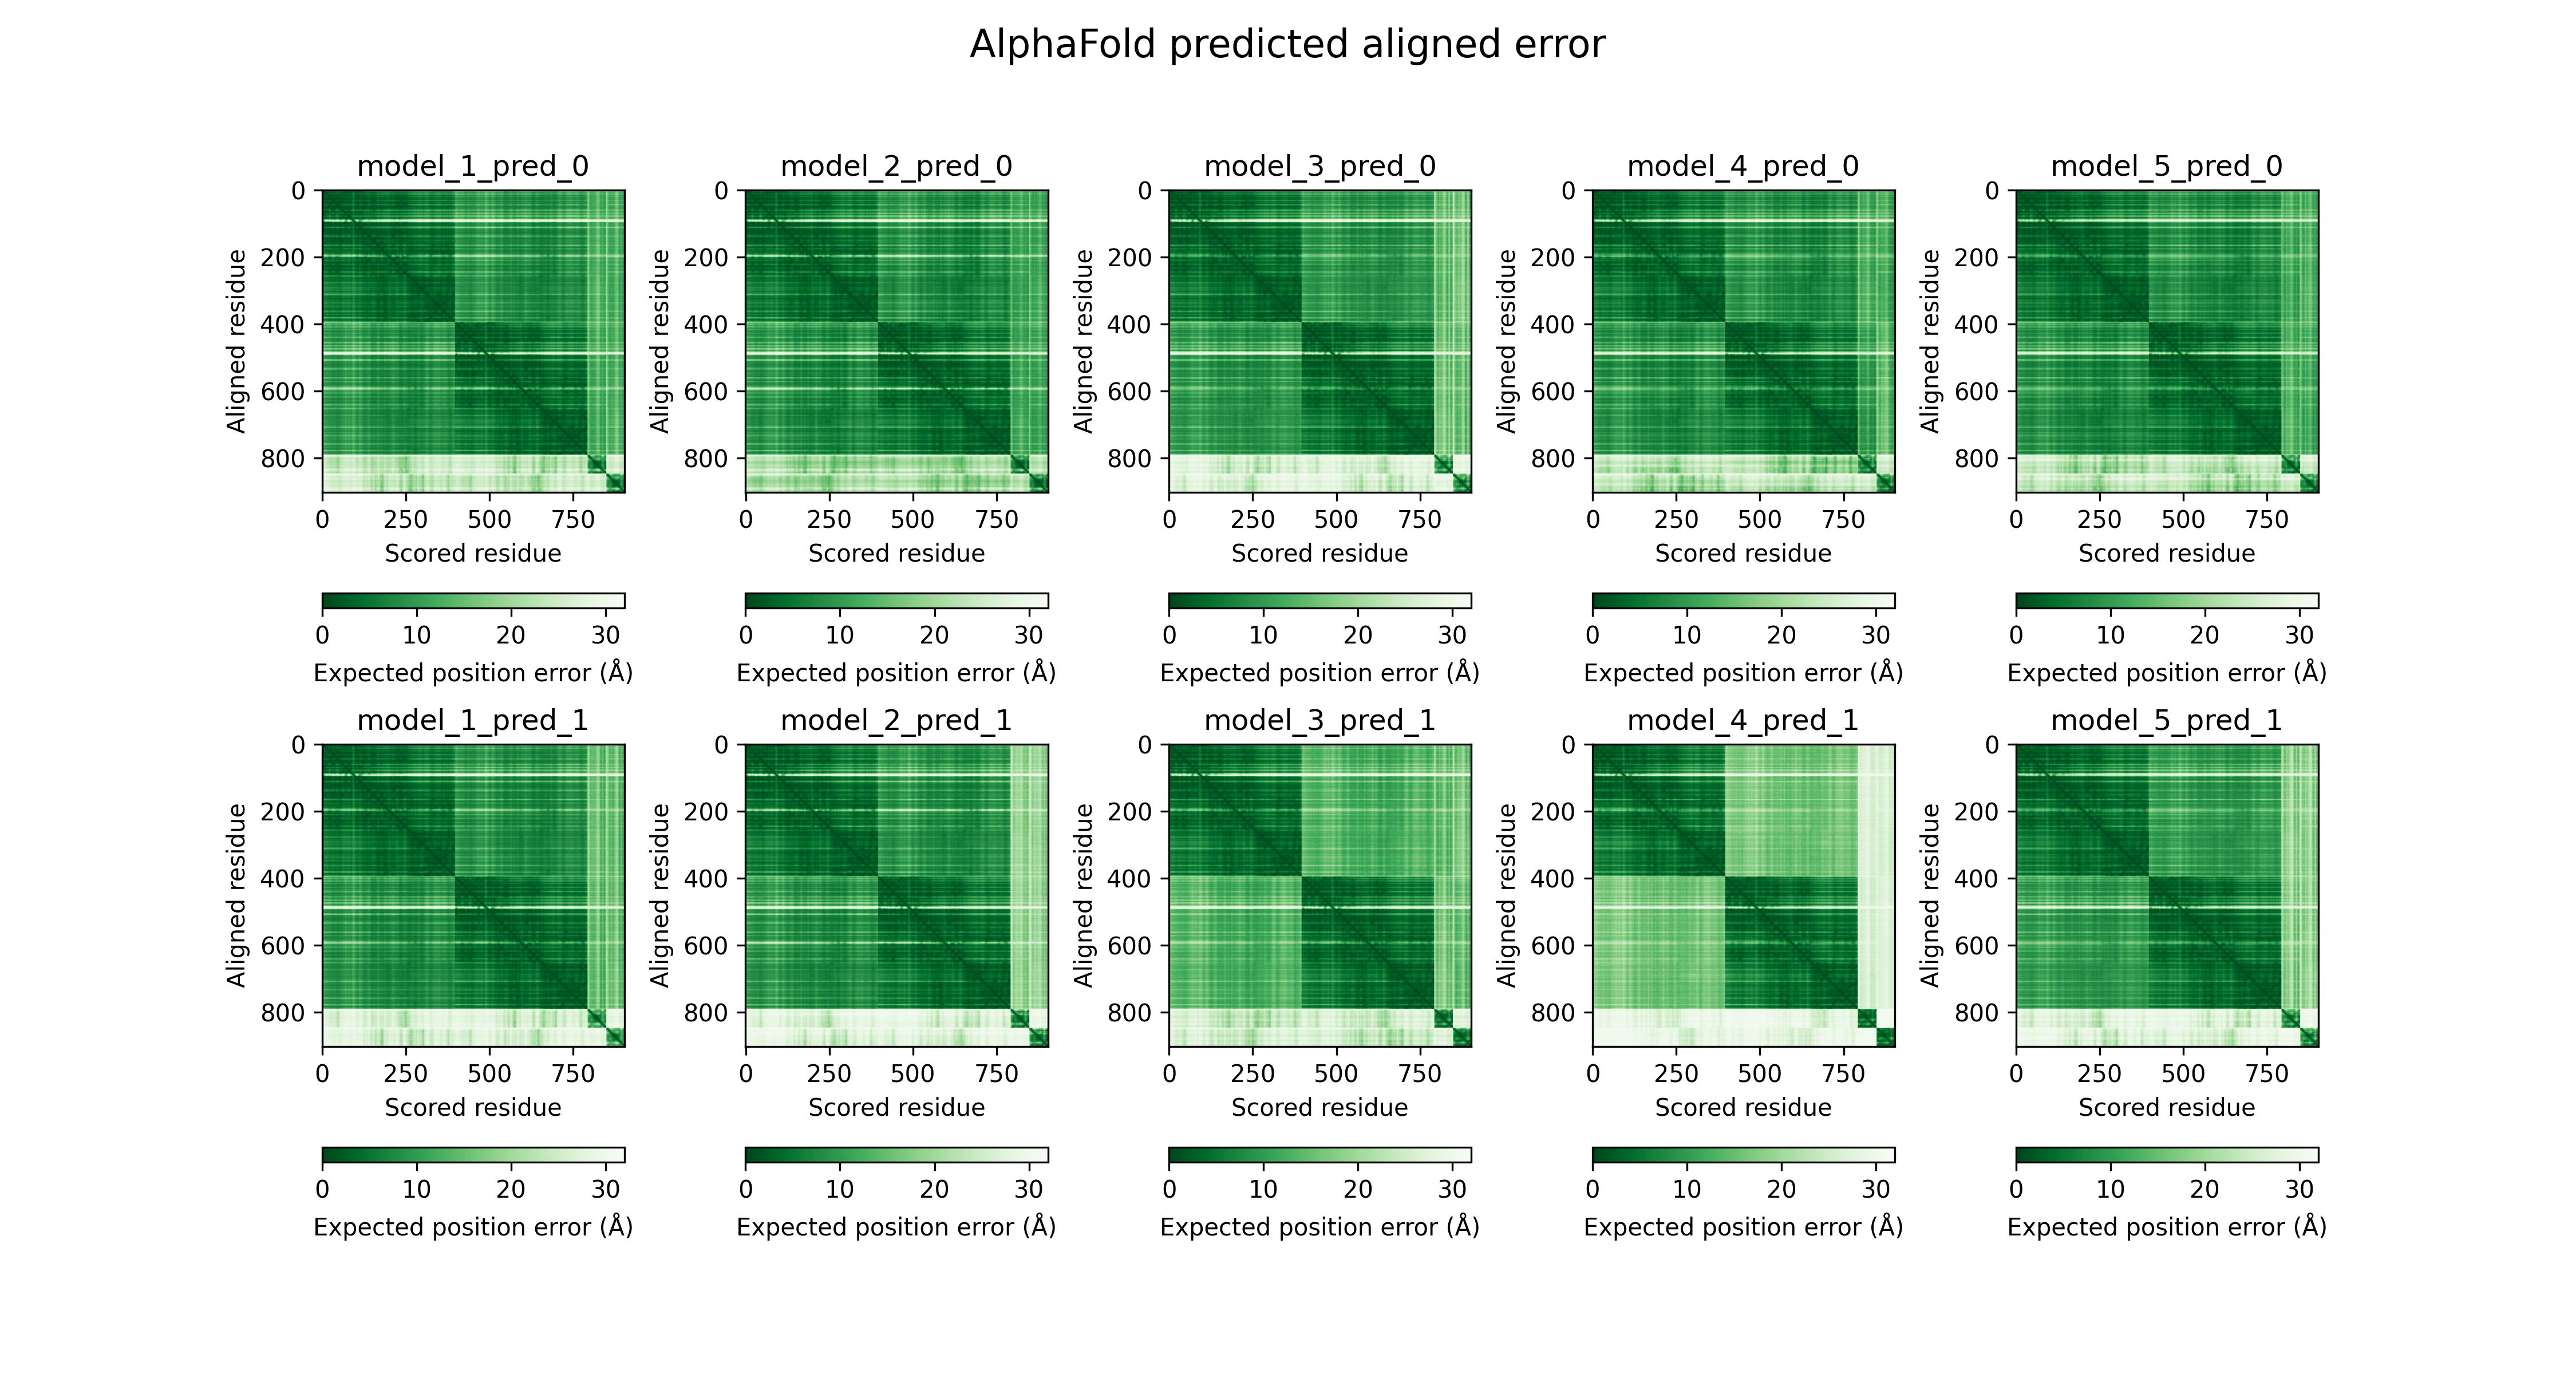
細かい描画、フォントサイズ、フォント設定などはMatplotlibのマニュアルを参考にすれば変更可能です。
ProteinXには以下のファイルが含まれていることを確認してください。features.pklとresult_model_[1-5]_ptm_pred_0.pklが必要なファイルです。
ProteinX/
├── features.pkl
├── msas
│   ├── bfd_uniref_hits.a3m
│   ├── mgnify_hits.sto
│   ├── pdb_hits.hhr
│   └── uniref90_hits.sto
├── ranked_[0-4].pdb
├── ranking_debug.json
├── relax_metrics.json
├── relaxed_model_[1-5]_ptm_pred_0.pdb
├── result_model_1_ptm_pred_0.pkl
├── result_model_2_ptm_pred_0.pkl
├── result_model_3_ptm_pred_0.pkl
├── result_model_4_ptm_pred_0.pkl
├── result_model_5_ptm_pred_0.pkl
├── timings.json
└── unrelaxed_model_[1-5]_ptm_pred_0.pdb