Spring Boot 2.0が今月頭2018/3/1にリリースされましたね!
https://spring.io/blog/2018/03/01/spring-boot-2-0-goes-ga
前々回、前回に引き続き、今回もアプリケーションモニタリングの話、Spring Boot 2.0でモニタリングがどうなったかをお話します。
リリースノート
モニタリング部分は、Spring Boot 2.0 のリリースノートのMicrometerのチャプターにあたります。
Spring Boot 2.0からMicrometerというものがメトリックスのベース部分として採用されました。
では、まずMicrometerがどういったものか見ていきたいと思います。
Micrometer
正直、私自身はMicrometerは初耳でした。
トップページの説明文を見ると、
Micrometer provides a simple facade over the instrumentation clients for the most popular monitoring systems, allowing you to instrument your JVM-based application code without vendor lock-in. Think SLF4J, but for metrics.
とあります。
いろいろなモニタリングツールがあるので、Micrometerはそれを意識せずに使える共通的なインタフェースを提供してくれるものというのが私の理解です。
いま現在サポートしているモニタリングツールは以下で、メジャーなものはサポートされているようです。
これらのものは統一的なインタフェースと簡単な設定でモニタリングが開始できるようです。
モニタリングの実装
さて、それでは実際にモニタリングの実装をしていきたいと思います。
Spring Boot 2.0からMicrometerがデフォルトで追加されるようになったため、実装自体は簡単にできそうです。
いろいろ確認しながら、今回はPrometheusでのモニタリングを実装していきます。進めていく手順は以下を参考にですね。
- https://docs.spring.io/spring-boot/docs/current/reference/htmlsingle/#production-ready-metrics
- https://micrometer.io/docs/registry/prometheus
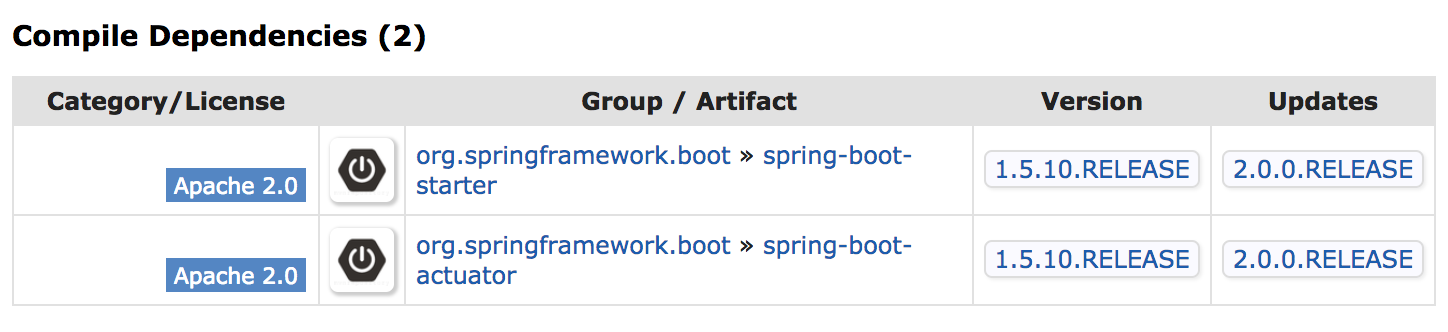
まずSpring Boot Actuatorをdependencyに追加します。
Spring Boot 2.0からspring-boot-actuator-starterにメトリックスのベース部分となるMicrometerが追加されているためです。
↓1.5.10.RELEASE
↓2.0.0.RELEASE
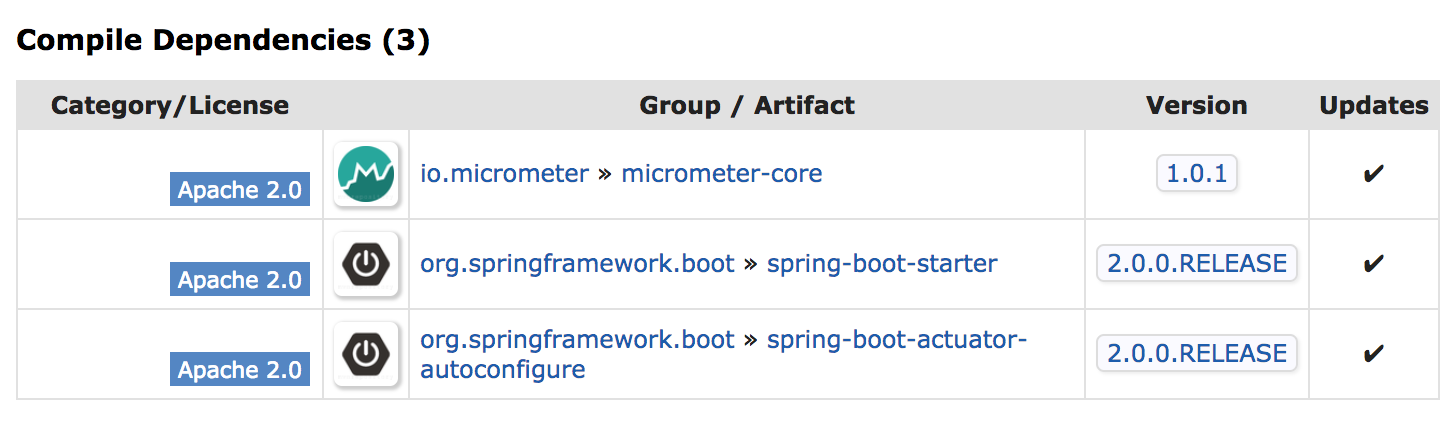
たしかにMicrometerが追加されていますね。
それに加えて、pom.xmlに対象のモニタリングツール(今回はmicrometer-registry-prometheus)のdependencyを追加します。
(今回はWEBアプリケーションを想定して、spring-boot-starter-webも追加しています。)
	<dependencies>
		<dependency>
			<groupId>org.springframework.boot</groupId>
			<artifactId>spring-boot-starter-actuator</artifactId>
		</dependency>
		<dependency>
			<groupId>org.springframework.boot</groupId>
			<artifactId>spring-boot-starter-web</artifactId>
		</dependency>
		<dependency>
			<groupId>io.micrometer</groupId>
			<artifactId>micrometer-registry-prometheus</artifactId>
		</dependency>

		<dependency>
			<groupId>org.springframework.boot</groupId>
			<artifactId>spring-boot-starter-test</artifactId>
			<scope>test</scope>
		</dependency>
	</dependencies>
バージョンの記載はspring-boot-starter-parentで管理されているので不要なはず。
↓
https://github.com/spring-projects/spring-boot/blob/master/spring-boot-project/spring-boot-dependencies/pom.xml#L123
dependencyの追加により、Prometheus用にAuto-configuratedされます。
PrometheusMetricsExportAutoConfiguration クラスの@ConditionalOnClass({PrometheusMeterRegistry.class})の条件が満たされるためです。
@Configuration
@AutoConfigureBefore({CompositeMeterRegistryAutoConfiguration.class, SimpleMetricsExportAutoConfiguration.class})
@AutoConfigureAfter({MetricsAutoConfiguration.class})
@ConditionalOnBean({Clock.class})
@ConditionalOnClass({PrometheusMeterRegistry.class})
@ConditionalOnProperty(
    prefix = "management.metrics.export.prometheus",
    name = {"enabled"},
    havingValue = "true",
    matchIfMissing = true
)
@EnableConfigurationProperties({PrometheusProperties.class})
public class PrometheusMetricsExportAutoConfiguration {
    ...

    @ManagementContextConfiguration
    public static class PrometheusScrapeEndpointConfiguration {
        ...
    }
}
PrometheusはPull側なので、エンドポイント/actuator/prometheusが追加されます。
エンドポイントの追加は、PrometheusMetricsExportAutoConfigurationの内部クラスである、PrometheusScrapeEndpointConfigurationが設定を行っています。
セキュリティの観点からデフォルトではActuator関連のエンドポイントは一部しか公開されていないので、propertyファイルに設定を追加して、エンドポイントを公開します。
management.endpoints.web.exposure.include=prometheus
これだけで、Prometheus用のモニタリング設定は完了です。
Spring BootアプリケーションをRunして、http://localhost:8080/prometheusにアクセスすると、モニタリング情報が表示されます。
Prometheusで可視化
PrometheusにはDockerを使ってしまいます。
以下のようにprometheus.ymlを用意して、docker runしてしまいます。
# A scrape configuration containing exactly one endpoint to scrape:
scrape_configs:
  # The job name is added as a label `job=<job_name>` to any timeseries scraped from this config.
  - job_name: 'spring-boot-2.0'

    # Override the global default and scrape targets from this job every 5 seconds.
    scrape_interval: 5s

    # List of labeled statically configured targets for this job.
    static_configs:
      - targets: ['your_ip:8080'] # 1

    # The HTTP resource path on which to fetch metrics from targets.
    metrics_path: /actuator/prometheus # 2
$ docker run -p 9090:9090 -v path_prometheus_yml:/etc/prometheus/prometheus.yml prom/prometheus
少し補足しておきます。
- DockerからホストのSpring Bootアプリケーションにアクセスするため、localhostではなく、IP指定でのアクセスが必要になります。
- メトリックスのエンドポイントを指定しています。
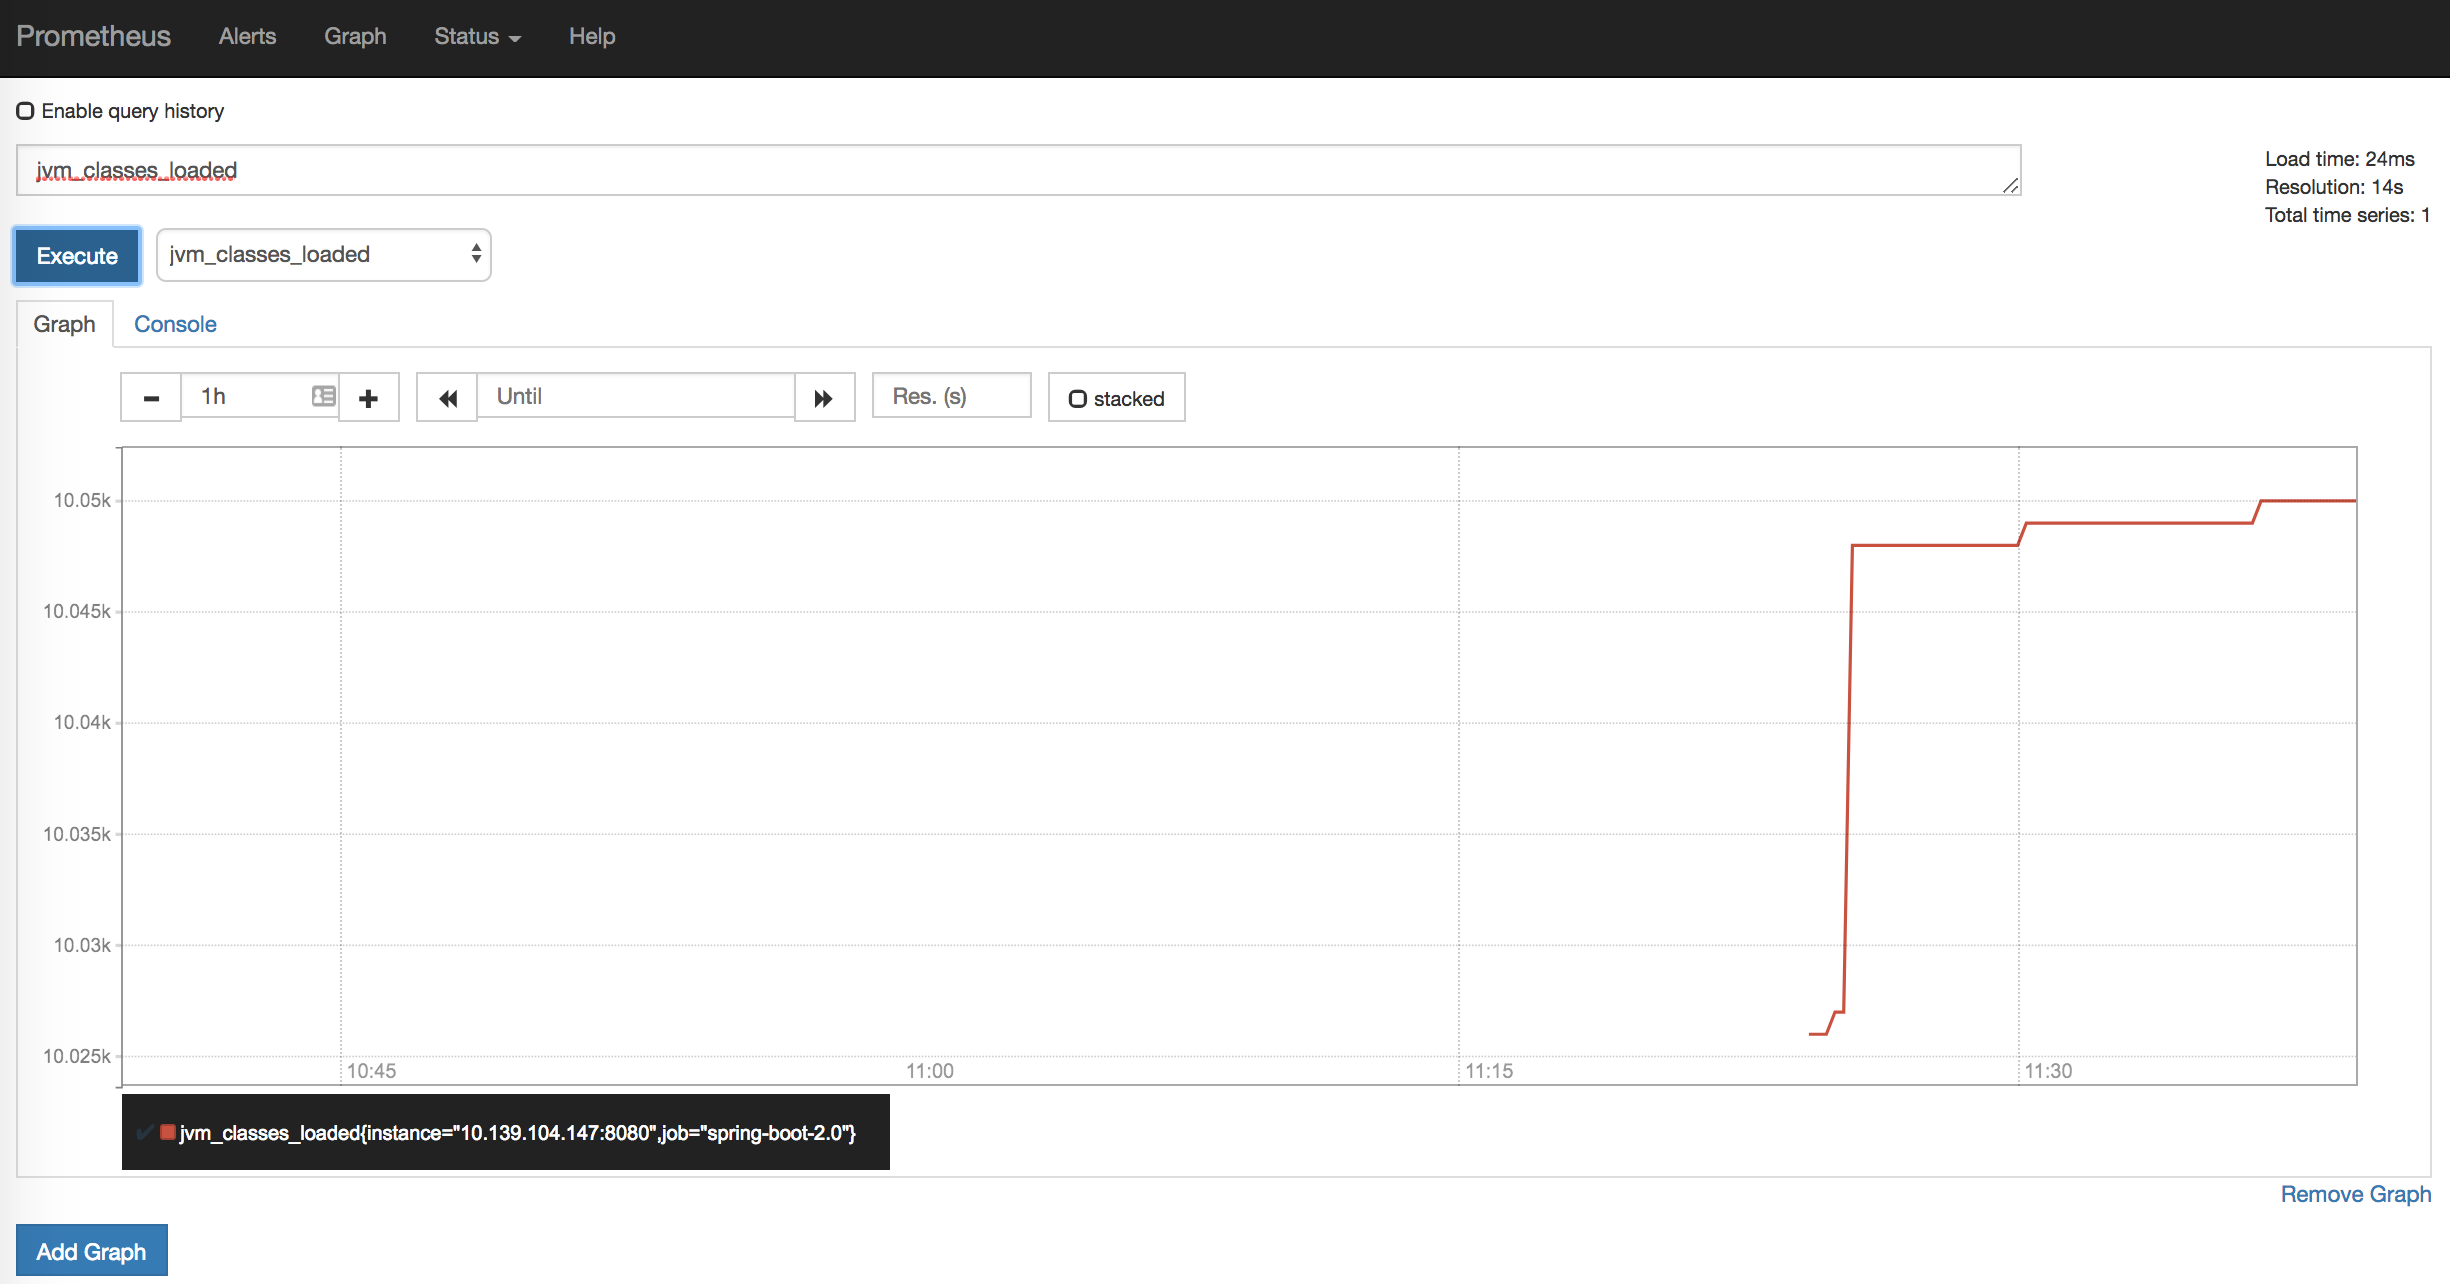
これで、http://localhost:9090/にアクセスすればPrometheusが起動できています。
あとはGUI上で、取りたいメトリックスを指定すればOKです。これはjvm_classes_loadedを指定した例になります。
補足
今回は触れませんでしたが、特定のアプリケーションのメトリックス(例えば、来店人数を数えるようなCounterメトリックス)を、モニタリングツールに依らない形式で実装方法は以下を参照してください。
またSpring Boot 1.5でもMircrometerへの対応方法が書いてあるので、まだ2.0に上げていない場合は参考にしてください。
GitHub
いつものようにサンプルをGitHub上にアップしてあるので参考にしてください。
最後に
Spring Boot 2.0がリリースされて本当に嬉しいし、早く全貌をキャッチアップ&使いたおしたいところです。
アプリケーションのモニタリングについては、今までは実装するのが少し大変でアプリケーションごとに工夫していた気がします(例えば、前々回、前回)。
しかし、今後はMicrometerがSpring Bootでのモニタリングのデファクトスタンダードになっていくので、簡単に使えるようになって嬉しい限りです。