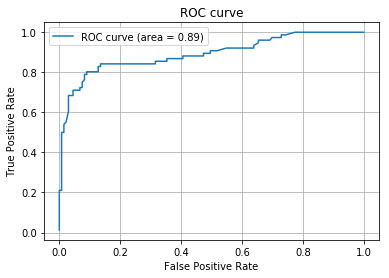
PythonでROC曲線を描画してみた
前提
- Python
- ロジスティック回帰で予測値出力済み
- scikit-learnとmatplotlibを使う
コード
roc.py
from sklearn import metrics
import matplotlib.pyplot as plt
import numpy as np

# FPR, TPR(, しきい値) を算出
fpr, tpr, thresholds = metrics.roc_curve(test_y, predict_y)

# ついでにAUCも
auc = metrics.auc(fpr, tpr)

# ROC曲線をプロット
plt.plot(fpr, tpr, label='ROC curve (area = %.2f)'%auc)
plt.legend()
plt.title('ROC curve')
plt.xlabel('False Positive Rate')
plt.ylabel('True Positive Rate')
plt.grid(True)
参考
ROC曲線とAUCについてはこちらを参考に。