申し訳御座いません。
たまたまmbassの関連でこちらの記事を際閲覧して見ましたが
出来ませんでしたので一度閲覧は中止します。
※たぶん、顔認識の学習を同一raspberry piで対応したため階層が違ったためだと思います。
また原因等判明いたしましたら再開しますので宜しくお願いします。
今回はrasberry pi 3と20種類センサーの温度センサーを組み合わせて、
pythonでリアルタイムグラフに挑戦。
購入したのは、rasberry pi 3と20種類センサー
配線の手順とデータの手順取得は下記のURL,
※このURLでもかかれてあるとおり、配線はGNDなどの順番が入り混じっているので、
とにかくこの際との通りの配線で問題なし↓。
※04.02.17追記配線が若干理解しずらいかもしれないので。
まずはgpioについて
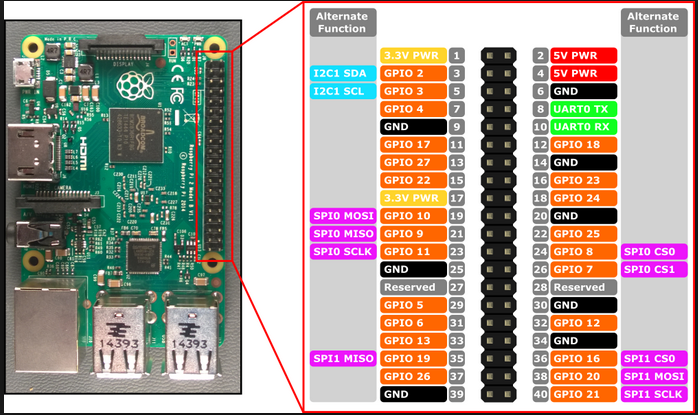
次は配線方法:
こちらはDQピンをGPIO4に、VDDピンを3.3V、GNDピンをGNDへ接続しました。
で、DQピンとVDDピンの間を10KΩの抵抗でプルアップします。
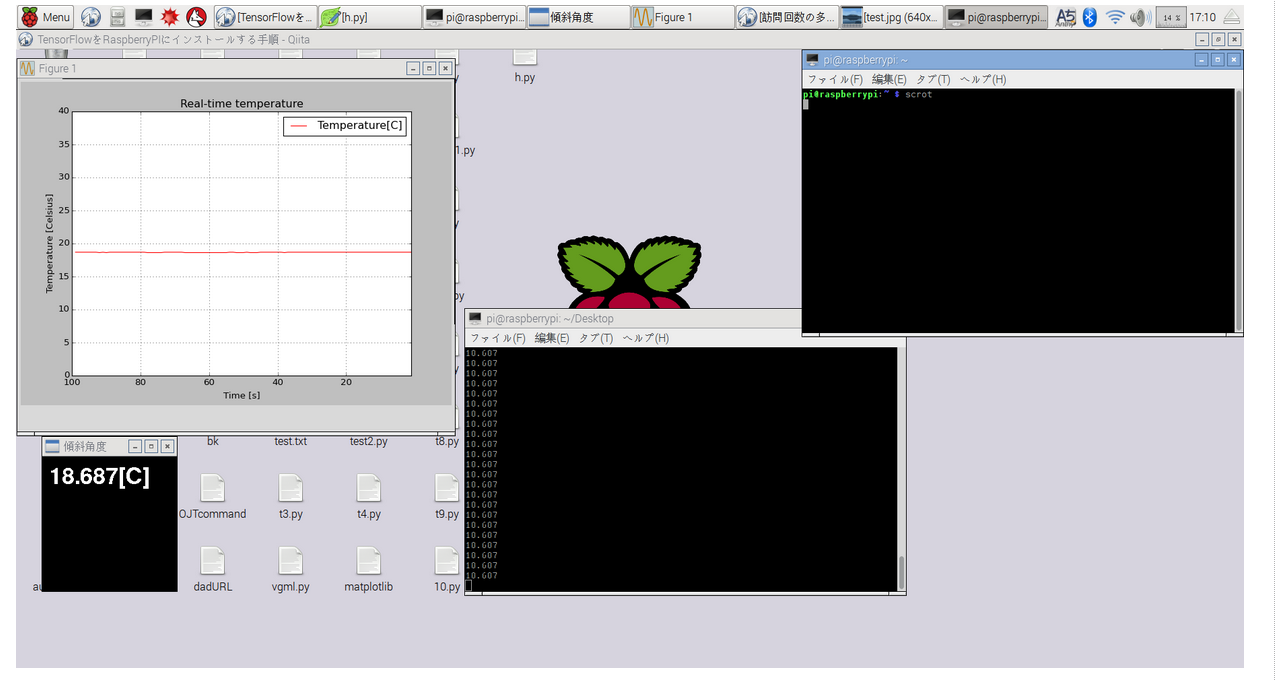
後個人的には、値のリアルタイムグラフ化をしたくて、下記のコードを作成。
実行すると、下記の画像の通り(※少しみづらいですが、左上にリアルタイムグラフ、左下にリアルタイムセンサーなどが表示されます。.右上のはキャプチャショットのプロンプトなので無視して下さい。)
=================================
↓ここからコピー
# -*- coding: utf-8 -*-
# http://denshi.blog.jp/arduino/temperature-graph
import numpy as np
import matplotlib.pyplot as plt
import pygame
from pygame.locals import *
import serial
import sys
import os
import glob
from time import sleep

os.system('modprobe w1-gpio')
os.system('modprobe w1-gpio')

base_dir = '/sys/bus/w1/devices/'
device_folder = glob.glob(base_dir + '28*')[0]
device_file = device_folder + '/w1_slave'
def read_temp_raw():
f = open(device_file, 'r')
lines = f.readlines()
f.close()
return lines


def read_temp():
lines = read_temp_raw()
while lines[0].strip()[-3:] != 'YES':
sleep(0.2)
lines = read_temp_raw()
equals_pos = lines[1].find('t=')
if equals_pos != -1:
temp_string = lines[1][equals_pos + 2:]
temp_c = float(temp_string) / 1000.0
return temp_c
def main():

temps = [0]*100 # 温度格納
t = np.arange(0,100,1)
plt.ion()
pygame.init() # Pygameを初期化
screen = pygame.display.set_mode((200, 200)) # 画面作成(100×100)
pygame.display.set_caption("傾斜角度") # タイトルバー
font = pygame.font.Font(None, 50) # 文字の設定

while True:
screen.fill((0,0,0)) # 画面のクリア
deviceTemp = read_temp()
print(read_temp())
temp = str(deviceTemp) # \nまで読み込む(\nは削除)
text = font.render(temp + "[C]", False, (255,255,255)) # 表示する文字の設定
screen.blit(text, (10, 10)) # レンダ,表示位置
pygame.display.flip() # 画面を更新して、変更を反映
# 温度データのリスト更新
temps.pop(99)
temps.insert(0,float(temp))
# グラフ表示設定
line, = plt.plot(t, temps, 'r-',label="Temperature[C]") # Y軸更新
line.set_ydata(temps)
plt.title("Real-time temperature")
plt.xlabel("Time [s]")
plt.ylabel("Temperature [Celsius]")
plt.legend()
plt.grid()
plt.xlim([100,1])
plt.ylim([0,40])
plt.draw()
plt.clf()
# print(read_temp())
for event in pygame.event.get():
# 終了ボタンが押されたら終了処理
if event.type == QUIT:
pygame.quit()
ser.close()
plt.close()
sys.exit()


if __name__ == '__main__':
main()