動作環境
GeForce GTX 1070 (8GB)
ASRock Z170M Pro4S [Intel Z170chipset]
Ubuntu 16.04 LTS desktop amd64
TensorFlow v1.2.1
cuDNN v5.1 for Linux
CUDA v8.0
Python 3.5.2
IPython 6.0.0 -- An enhanced Interactive Python.
gcc (Ubuntu 5.4.0-6ubuntu1~16.04.4) 5.4.0 20160609
GNU bash, version 4.3.48(1)-release (x86_64-pc-linux-gnu)
ADDA v.1.3b6
About
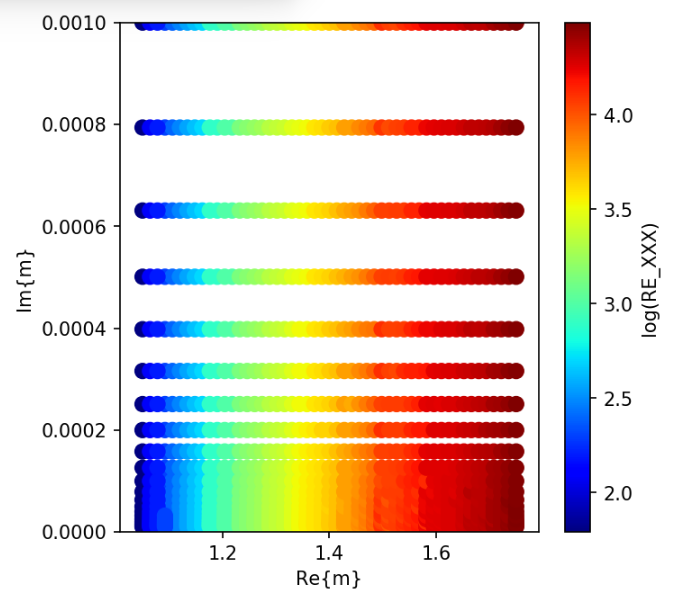
Is a tool to show the scatterplot of [the number of iterations] run for various values of Re{m} and Im{m} (m: refractive index).
Example input file
INPFILE = "ReIm_170916.tbl" # obtained using [read_numIter_170916_exec]
Ref: ADDA > bash script > read_numIter_170916_exec > to extract the number of iterations from log files.
v0.1
code
Run on Jupyter + Matplotlib.
2dplot_ReIm_170916.ipynb
import numpy as np
import matplotlib.pyplot as plt
import matplotlib.cm as cm
import sys
from pylab import rcParams

"""
v0.1 Sep. 16, 2017
   - show scatterplot of [number of iterations] of ADDA for various Re{m} and Im{m}
"""

# coding rule: PEP8

%matplotlib inline


rcParams['figure.figsize'] = 5, 5  # adjusted
rcParams['figure.dpi'] = 150  # adjusted

INPFILE = "ReIm_170916.tbl"  # obtained using [read_numIter_170916_exec]

# 1. get data
dat = np.genfromtxt(INPFILE, delimiter=',')

xs, ys, nums = [], [], []
for elem in dat:
    ax, ay, anum = elem
    xs += [ax]
    ys += [ay]
    nums += [anum]

color = np.log(nums)  # taking log to enhance the contrast
#color = nums

# 2. draw data
size = 60  # arbitrary
plt.scatter(xs, ys, size, color, cmap=cm.jet)
plt.xlabel('Re{m}')
plt.ylabel('Im{m}')
plt.ylim(0.0, 0.001)
cbar = plt.colorbar()
cbar.ax.set_ylabel('log(RE_XXX)')
result
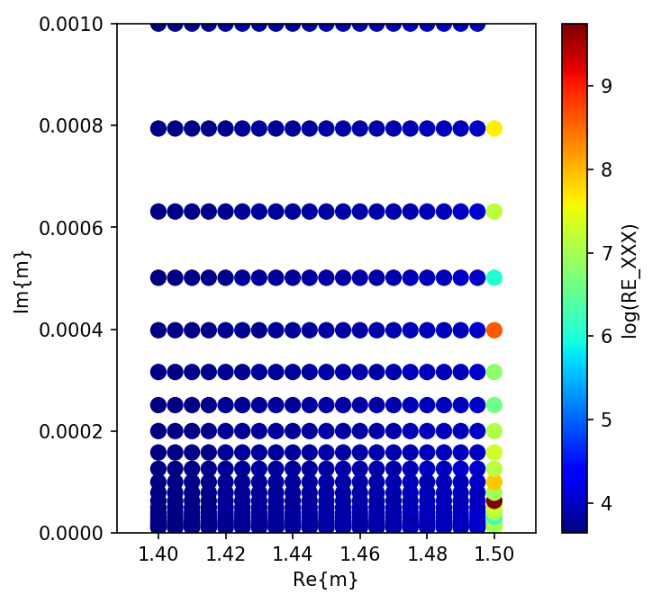
v0.2
Changed INPFILE.
code
2dplot_ReIm_170916.ipynb
import numpy as np
import matplotlib.pyplot as plt
import matplotlib.cm as cm
import sys
from pylab import rcParams

"""
v0.2 Sep. 16, 2017
   - use different INPFILE
v0.1 Sep. 16, 2017
   - show scatterplot of [number of iterations] of ADDA for various Re{m} and Im{m}
"""

# coding rule: PEP8

%matplotlib inline


rcParams['figure.figsize'] = 5, 5  # adjusted
rcParams['figure.dpi'] = 150  # adjusted

# obtained using [read_numIter_170916_exec]
#INPFILE = "ReIm_170916.tbl"   # ../CALC_1070819
INPFILE = "ReIm_run170916.Tbl"  # ../CALC_170916

# 1. get data
dat = np.genfromtxt(INPFILE, delimiter=',')

xs, ys, nums = [], [], []
for elem in dat:
    ax, ay, anum = elem
    xs += [ax]
    ys += [ay]
    nums += [anum]

color = np.log(nums)  # taking log to enhance the contrast
#color = nums

# 2. draw data
size = 60  # arbitrary
plt.scatter(xs, ys, size, color, cmap=cm.jet)
plt.xlabel('Re{m}')
plt.ylabel('Im{m}')
plt.ylim(0.0, 0.001)
cbar = plt.colorbar()
cbar.ax.set_ylabel('log(RE_XXX)')
run