GeForce GTX 1070 (8GB)
ASRock Z170M Pro4S [Intel Z170chipset]
Ubuntu 16.04 LTS desktop amd64
TensorFlow v1.2.1
cuDNN v5.1 for Linux
CUDA v8.0
Python 3.5.2
IPython 6.0.0 -- An enhanced Interactive Python.
gcc (Ubuntu 5.4.0-6ubuntu1~16.04.4) 5.4.0 20160609
GNU bash, version 4.3.48(1)-release (x86_64-pc-linux-gnu)
ADDA v.1.3b6
Background
This article is related to ADDA (light scattering simulator based on the discrete dipole approximation).
I have found that the number of iterations for a specific combination of Re{m} and Im{m} become large when using QMR (default iterative solver for ADDA), compared with those for different sets of Re{m} and Im{m}.
The numbers of iterations are shown below.
ADDA execution code
Python3 script.
import subprocess as sb
import numpy as np
import sys

# on Python 3.5.2

# codingrule: PEP8

RUN_PARAM = "-store_int_field -grid 26"
# RUN_PARAM = "-store_int_field"  # for test

# real part of refractive index (linear scale)
R_RANGE = 0.05  # linear
R_NUM = 21
R_CENTER = 1.45
mrs = np.linspace(R_CENTER - R_RANGE, R_CENTER + R_RANGE, R_NUM)
# imaginary part of refractive index (logarithmic scale)
I_RANGE = 1  # linear
I_NUM = 21
I_CENTER = -4
mis = 10**np.linspace(I_CENTER - I_RANGE, I_CENTER + I_RANGE, I_NUM)

# debug
# print(mrs)
# print(mis)
# sys.exit()

for amr in mrs:
    for ami in mis:
        print(amr, ami)
        # cmd = "./adda -m %f %f %s" % (amr, ami, RUN_PARAM)
        #cmd = "./adda -iter bcgs2 -m %f %f %s" % (amr, ami, RUN_PARAM)
        #cmd = "./adda -iter bicgstab -m %f %f %s" % (amr, ami, RUN_PARAM)
        #cmd = "./adda -iter cgnr -m %f %f %s" % (amr, ami, RUN_PARAM)
        #cmd = "./adda -iter bicg -m %f %f %s" % (amr, ami, RUN_PARAM)
        #cmd = "./adda -iter csym -m %f %f %s" % (amr, ami, RUN_PARAM)
        #cmd = "./adda -iter qmr -m %f %f %s" % (amr, ami, RUN_PARAM)
        cmd = "./adda -iter qmr2 -m %f %f %s" % (amr, ami, RUN_PARAM)
        print(cmd)
        sb.run(cmd.split(), stdout=sb.DEVNULL)
By executing the above, you will obtain the runXXX/ directories.
Number of iterations table creation
I have used the v0.2 of the bash script at ADDA > bash script > read_numIter_170916_exec > v0.1, v0.2 > to extract the number of iterations from log files.
bash read_numIter_170916_exec > ReIm_170916_qmr2.tbl
Scatterplot display
Matplotlib code
v0.3 modified from ADDA + Matplotlib > 2dplot_ReIm_170916.ipynb > v0.1, v0.2 > show scatterplot of [the number of iterations] for various values of Re{m} and Im{m}
import numpy as np
import matplotlib.pyplot as plt
import matplotlib.cm as cm
import matplotlib as mpl
import sys
from pylab import rcParams

"""
v0.3 WIP
   - use [ReIm_170916_bicgstab.tbl] and results using different iterative solvers
v0.2 Sep. 16, 2017
   - use different INPFILE
v0.1 Sep. 16, 2017
   - show scatterplot of [number of iterations] of ADDA for various Re{m} and Im{m}
"""

# coding rule: PEP8

%matplotlib inline


rcParams['figure.figsize'] = 5, 5  # adjusted
rcParams['figure.dpi'] = 150  # adjusted

# obtained using [read_numIter_170916_exec]
# INPFILE = "ReIm_170916.tbl"   # ../CALC_170819
# INPFILE = "ReIm_run170916.Tbl"  # ../CALC_170916

# comparison
INPFILE = "ReIm_170916_bicgstab.tbl"  # code from 170819 but for different iterative solver
INPFILE = "ReIm_170916_bicgstab2.tbl"  # same as above
INPFILE = "ReIm_170916_cgnr.tbl"  # same as above
INPFILE = "ReIm_170916_bicg.tbl"  # same as above
INPFILE = "ReIm_170916_csym.tbl"  # same as above
INPFILE = "ReIm_170916_qmr.tbl"  # same as above
INPFILE = "ReIm_170916_qmr2.tbl"  # same as above

# 1. get data
dat = np.genfromtxt(INPFILE, delimiter=',')

xs, ys, nums = [], [], []
for elem in dat:
    ax, ay, anum = elem
    xs += [ax]
    ys += [ay]
    nums += [anum]

color = np.log(nums)  # taking log to enhance the contrast
# color = nums

# 2. draw data
size = 60  # arbitrary
# plt.scatter(xs, ys, size, color, cmap=cm.jet, vmax=5)
plt.scatter(xs, ys, size, color, cmap=cm.jet)
# plt.scatter(xs, ys, size, color, cmap=cm.jet, norm=mpl.colors.LogNorm(), vmax=50)  # used with [color = nums]
plt.xlabel('Re{m}')
plt.ylabel('Im{m}')
plt.ylim(0.0, 0.001)
cbar = plt.colorbar()
cbar.ax.set_ylabel('log(RE_XXX)')
Result
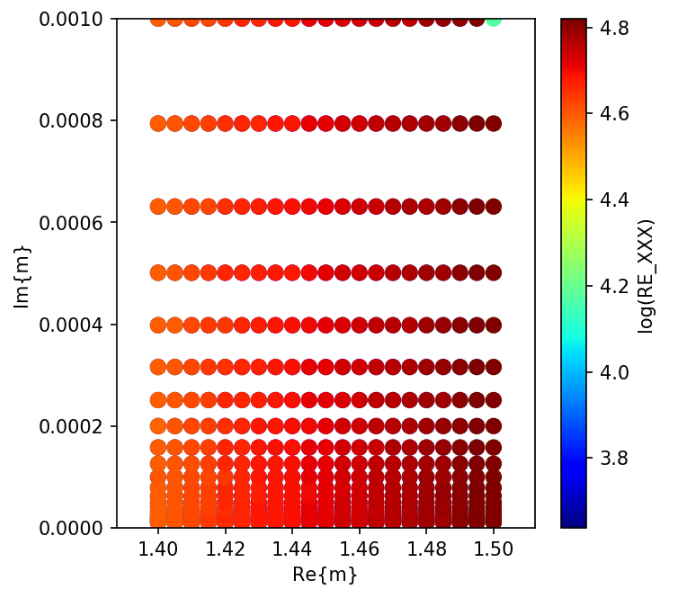
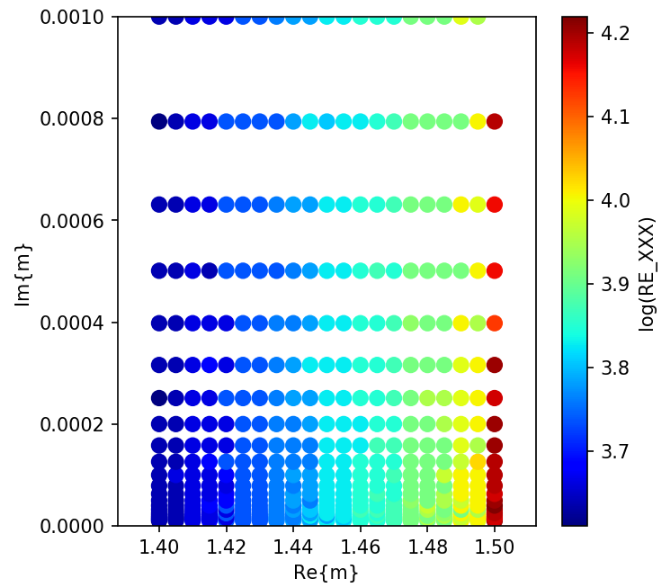
The number of iterations for different iterative solvers are shown below.
Bi-CGStab(2)
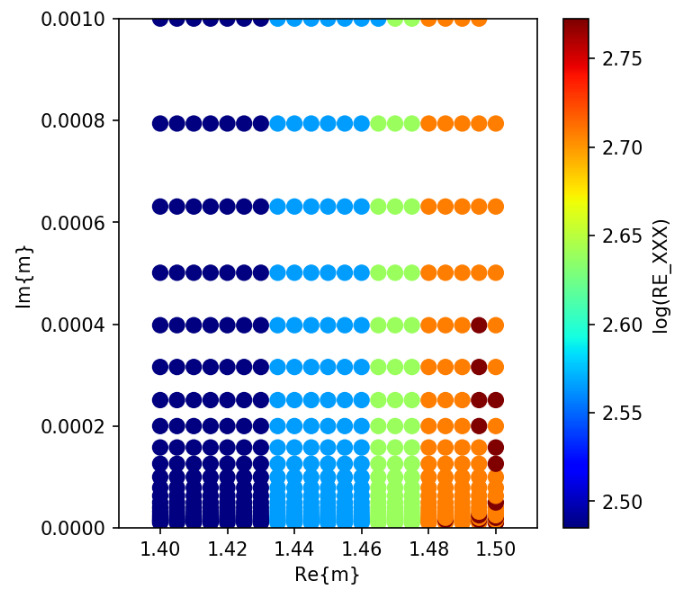
Bi-CG
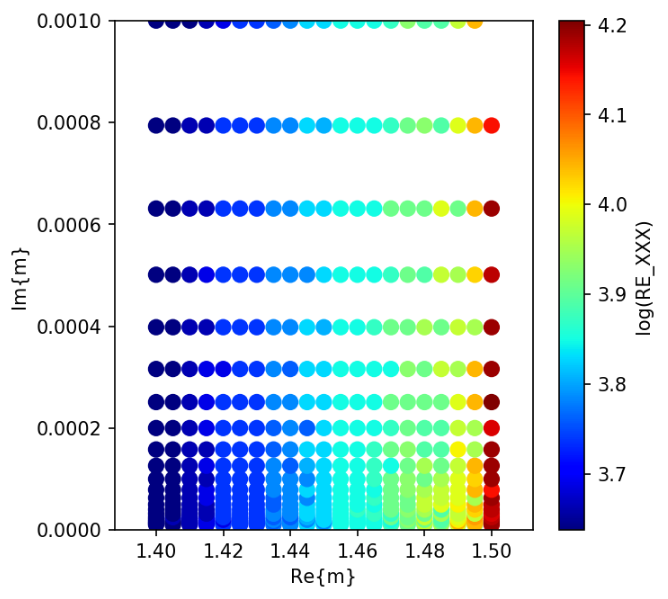
Bi-CGStab
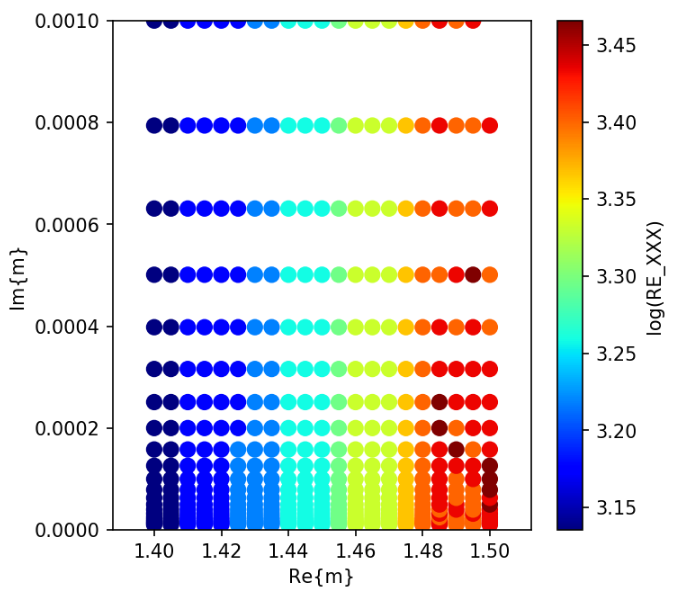
CGNR
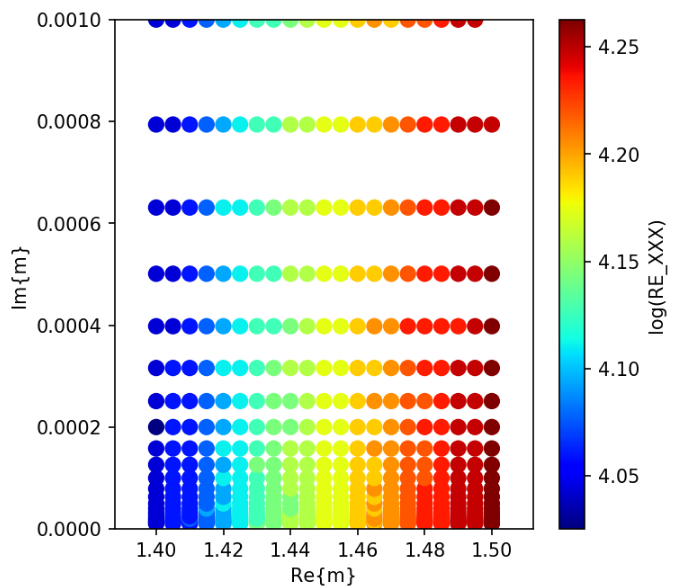
CSYM
QMR
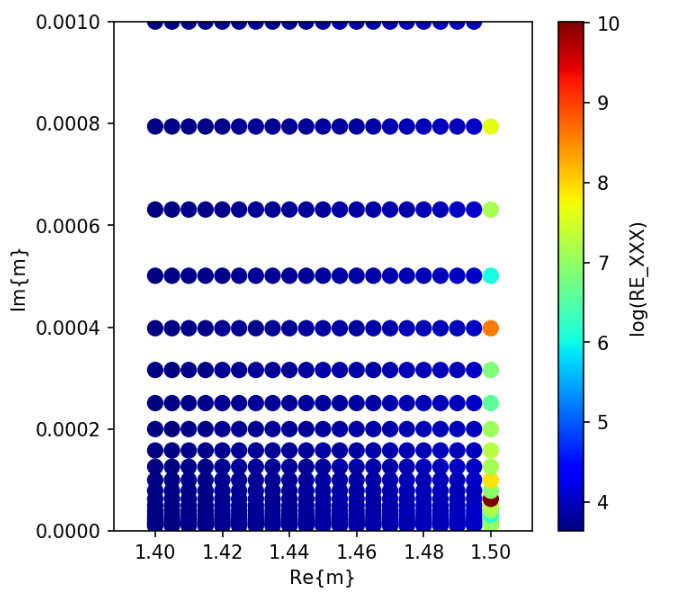
QMR2
Breakdown?
@ manual.pdf p39
All iterative solvers except CGNR and CSYM are susceptible to breakdown. ... For instance, simulation of light scattering by cube with edge length that is exactply multiple of the wavelength results in breakdowns of QMR, QMR2, and Bi-CG. ...