動作環境
GeForce GTX 1070 (8GB)
ASRock Z170M Pro4S [Intel Z170chipset]
Ubuntu 16.04 LTS desktop amd64
TensorFlow v1.2.1
cuDNN v5.1 for Linux
CUDA v8.0
Python 3.5.2
IPython 6.0.0 -- An enhanced Interactive Python.
gcc (Ubuntu 5.4.0-6ubuntu1~16.04.4) 5.4.0 20160609
GNU bash, version 4.3.48(1)-release (x86_64-pc-linux-gnu)
scipy v0.19.1
geopandas v0.3.0
MATLAB R2017b (Home Edition)
ADDA v.1.3b6
散布図の上にx軸のデータをテキスト表示してみた。
参考
code抜粋
下記の例では45度の傾きを設定している。
また、y位置を少し上げている。
def draw_asANumberOfOrientations(ax, numOris, s11s, atitle=''):
    ax.set_xscale("log")
    ax.set_title(atitle)
    ax.scatter(numOris, s11s, color='blue', marker='.')
    ax.set_xlabel('Nori')
    for xpos, ypos in zip(numOris, s11s):
        # 0.1:arbitrary to adjust text position
        ax.text(xpos, ypos + 0.1, str(xpos), rotation=45.0)
code v0.1
HammersleyNodeによる球積分の結果を使う。
(Note: ファイルがないため閲覧者は実行できません。)
showNoriMueller_180203.ipynb
%matplotlib inline
import matplotlib.pyplot as plt
from matplotlib import cm, colors
from mpl_toolkits.mplot3d import Axes3D
from pylab import rcParams
import numpy as np
import time


"""
v0.1 Feb. 03, 2018
  - draw_asANumberOfOrientations() draws [Nori] text
  - add draw_asANumberOfOrientations()
  - add get_numberOfOrientations()
  - remove draw_degreeOfPolarization()
  - remove draw_phaseFunction()
  - branched from [showMueller_180113]
---
v0.6 Jan. 28, 2018
  - fix bug > read_s11_and_polarization() was reading [IN_FILE] not [infile]
v0.5 Jan. 20, 2018
  - read list of files defined at IN_FILES[]
  - add read_s11_and_polarization()
  - change from [scatter plot] to [line plot]
v0.4 Jan. 14, 2018
  - refactor > remove_outsideOf() > use Boolean indexing
  - refactor > use set_xticks() instead of plt.xticks()
v0.3 Jan. 13, 2018
  - show enlarged version (3rd and 4th graph)
    + add remove_outsideOf()
v0.2 Jan. 13, 2018
  - show [degree of polarization]
v0.1 Jan. 13, 2018
  - set x axis ticks to 30 degree
  - show [S11] as a function of [Theta]
"""

# Coding rule:PEP8

rcParams['figure.figsize'] = 10, 4
rcParams['figure.dpi'] = 110


def read_s11_and_polarization(infile):
    dat = np.genfromtxt(infile, delimiter=' ', skip_header=1)
    thetas = []
    s11s = []
    pols = []
    for elem in dat:
        thetas += [elem[0]]
        s11s += [elem[1]]
        pols += [-elem[2] / elem[1] * 100]
    return thetas, s11s, pols


def remove_outsideOf(xs, ys, xmin, xmax):
    xns, yns = np.array(xs), np.array(ys)
    keep_flgs = (xns >= xmin) & (xns <= xmax)
    return xns[keep_flgs], yns[keep_flgs]


IN_FILES = [
    # 1234567890123456
    'mueller_gHN_N0030',
    'mueller_gHN_N0060',
    'mueller_gHN_N0100',
    'mueller_gHN_N0300',
    'mueller_gHN_N0500',
    'mueller_gHN_N1000',
    'mueller_gHN_N1500',
    'mueller_gHN_N2000',
]  # from ADDA


def get_numberOfOrientations(filename):
    return int(filename[-4:])  # -4: e.g. _N0030


def draw_asANumberOfOrientations(ax, numOris, s11s, atitle=''):
    ax.set_xscale("log")
    ax.set_title(atitle)
    ax.scatter(numOris, s11s, color='blue', marker='.')
    ax.set_xlabel('Nori')
    for xpos, ypos in zip(numOris, s11s):
        # 0.1:arbitrary to adjust text position
        ax.text(xpos, ypos + 0.1, str(xpos), rotation=45.0)

PICKUP_THETA_IDX = 170  # Pick up position of the Theta (Scattring angle)

# Pickup values at a specified scattering angle
numOris = []  # Nori (Number of orientations)
Nori_s11s = []  # S11 as a function of Nori(Number of orientations)
Nori_pols = []  # Pol as a function of Nori(Number of orientations)
for afile in IN_FILES:
    thetas, s11s, pols = read_s11_and_polarization(afile)
    numOris += [get_numberOfOrientations(afile)]
    Nori_s11s += [s11s[PICKUP_THETA_IDX]]
    Nori_pols += [pols[PICKUP_THETA_IDX]]
    print(numOris[-1], Nori_s11s[-1], Nori_pols[-1])

# Plot
fig = plt.figure()
ax1a = fig.add_subplot(2, 2, 1)
title = 'Phase function (%s deg)' % PICKUP_THETA_IDX
draw_asANumberOfOrientations(ax1a, numOris, Nori_s11s, title)
ax1b = fig.add_subplot(2, 2, 2)
title = 'Degree of Polarization (%s deg)' % PICKUP_THETA_IDX
draw_asANumberOfOrientations(ax1b, numOris, Nori_pols, title)

fig.tight_layout()
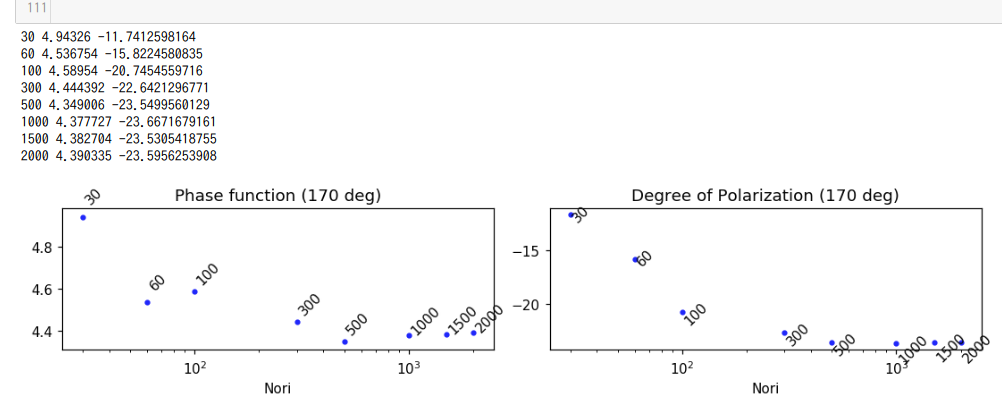
Degree of Polarizationの方はテキストの表示位置が希望のものになっていない。
相対位置の処理にしてみたが失敗した。
MIT (Most Important Task)でないので、保留。