動作環境
C++ Builder XE4
TeeChart Lite v2013.08.130414 32bit VCL
関連
- v0.1: C++ Builder XE4 > TeeChart > クリックした点に近い系列データの明示 > 点と値の表示 > v0.1..v0.2
- 前回: C++ Builder XE4 > TeeChart > クリックした点に近い系列データの明示 > 点と値の表示 > v0.4: クリック時に縦方向に線を明示するようにする
概要
- 2つの系列のデータに対してインデックスを取得
- 日時が異なるインデックスが取得された
- Clicked(X, Y)の処理によるようだ
- 未確認であるが、値が大きい方に引っ張られるのではないだろうか
- v0.4でY方向上から走査するため?
確認
実装してみた (2018-11-29)
Unit1.h
//---------------------------------------------------------------------------

#ifndef Unit1H
#define Unit1H
//---------------------------------------------------------------------------
#include <System.Classes.hpp>
#include <Vcl.Controls.hpp>
#include <Vcl.StdCtrls.hpp>
#include <Vcl.Forms.hpp>
#include <Vcl.ExtCtrls.hpp>
#include <VCLTee.Chart.hpp>
#include <VCLTee.Series.hpp>
#include <VCLTee.TeEngine.hpp>
#include <VCLTee.TeeProcs.hpp>
//---------------------------------------------------------------------------
class TForm1 : public TForm
{
__published:    // IDE で管理されるコンポーネント
    TChart *Chart1;
    TFastLineSeries *Series1;
    TEdit *E_xvalue;
    TEdit *E_yvalue;
    TPointSeries *Series2;
    TFastLineSeries *Series3;
    TPointSeries *Series4;
    void __fastcall Chart1MouseDown(TObject *Sender, TMouseButton Button, TShiftState Shift,
          int X, int Y);
private:    // ユーザー宣言
public:     // ユーザー宣言
    __fastcall TForm1(TComponent* Owner);
};
//---------------------------------------------------------------------------
extern PACKAGE TForm1 *Form1;
//---------------------------------------------------------------------------
#endif
Unit1.cpp
//---------------------------------------------------------------------------

#include <vcl.h>
#pragma hdrstop

#include <DateUtils.hpp>
#include "Unit1.h"
//---------------------------------------------------------------------------
#pragma package(smart_init)
#pragma resource "*.dfm"
TForm1 *Form1;
//---------------------------------------------------------------------------
__fastcall TForm1::TForm1(TComponent* Owner)
    : TForm(Owner)
{
    // テスト用の系列データ追加

    Chart1->Series[0]->XValues->DateTime = true;
    Chart1->BottomAxis->DateTimeFormat = L"nn:ss";

    TDateTime dt;

    double yval;
    // 一つ目のシリーズ
    dt = Now();
    for (int idx=0; idx < 10; idx++) {
        yval = (1+ idx) % 3;
        Series1->AddXY(dt, yval, "", clRed);
        dt = IncSecond(dt, 1);
    }

    // 二つ目のシリーズ
    dt = Now();
    for (int idx=0; idx < 10; idx++) {
        yval = (1+ idx + 1) % 3;
        Series3->AddXY(dt, yval, "", clRed);
        dt = IncSecond(dt, 1);
    }

}
//---------------------------------------------------------------------------

#define POINT_NOT_FOUND (-1)

void __fastcall TForm1::Chart1MouseDown(TObject *Sender, TMouseButton Button, TShiftState Shift,
          int X, int Y)
{
    TFastLineSeries *targetPtrs[] = { Series1, Series3 };
    int numSer = sizeof(targetPtrs) / sizeof(targetPtrs[0]);
    TPointSeries *markerPtrs[] = { Series2, Series4 };

    // グラフ上端から下端まで走査してインデックスを見つける
    int top = Chart1->ChartRect.Top;
    int btm = Chart1->ChartRect.Bottom;
    int index = POINT_NOT_FOUND;  // 系列のインデックスが入る

    for(int tgtIdx = 0; tgtIdx < numSer; tgtIdx++) {  // tgtIdx: target index
        for(int ypos = top; ypos <= btm; ypos++) {
            index = targetPtrs[tgtIdx]->Clicked(X, ypos);
            if (index != POINT_NOT_FOUND) {
                break;
            }
        }

        // A. クリックが外れていたときに消す
        if (index == POINT_NOT_FOUND) {
            if (markerPtrs[tgtIdx]->Count() > 0) {
                markerPtrs[tgtIdx]->Delete(0);
                E_xvalue->Text = L"";
                E_yvalue->Text = L"";
            }
            continue;
        }

        // B. クリックが線上の時に表示

        // 既存のものは消す
        if (markerPtrs[tgtIdx]->Count() > 0) {
            markerPtrs[tgtIdx]->Delete(0);
        }

        // 点の追加
        double xval = targetPtrs[tgtIdx]->XValue[index];
        double yval = targetPtrs[tgtIdx]->YValue[index];
        markerPtrs[tgtIdx]->AddXY(xval, yval);

        E_xvalue->Text = String().sprintf(L"%.3f", xval);
        E_yvalue->Text = String().sprintf(L"%.3f", yval);
    }

}
//---------------------------------------------------------------------------
動作例
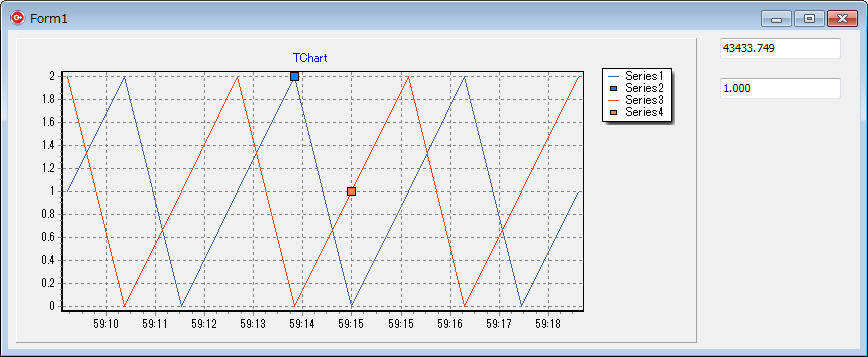
異なるインデックスになる結果が確かに再現できた。
この状態になるのは「まれ」ではある。
再現条件は未確認。
再現条件
下記の時間軸をクリックすると発生する。
- 系列1の変曲点の時間軸
- 系列2は単調増加(減少)の時間軸
改善案
- 日時だけはClicked(X, Y)で取得する
- その日時に基づき、自前で系列1のデータを探索する
- 同様に、系列Nのデータを探索する