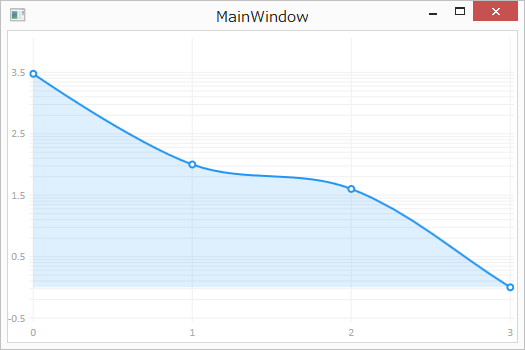
動作環境
Windows 8.1 Pro (64bit)
Microsoft Visual Studio 2017 Community
Sublime Text 2
処理内容
- Y軸を対数スケールにする
参考
code
上記を参考にY軸を対数スケールにするコードを実装してみる。
MainWindow.xaml
<Window x:Class="_171124_t1845_logscale.MainWindow"
        xmlns="http://schemas.microsoft.com/winfx/2006/xaml/presentation"
        xmlns:x="http://schemas.microsoft.com/winfx/2006/xaml"
        xmlns:d="http://schemas.microsoft.com/expression/blend/2008"
        xmlns:mc="http://schemas.openxmlformats.org/markup-compatibility/2006"
        xmlns:local="clr-namespace:_171124_t1845_logscale"
        xmlns:lvc="clr-namespace:LiveCharts.Wpf;assembly=LiveCharts.Wpf"
        mc:Ignorable="d"
        Title="MainWindow" Height="350" Width="525">
    <Grid>
        <lvc:CartesianChart Series="{Binding seriesCollection}">
            <lvc:CartesianChart.AxisY>
                <lvc:LogarithmicAxis Base="{Binding Base}"/>
            </lvc:CartesianChart.AxisY>
        </lvc:CartesianChart>
    </Grid>
</Window>
MainWindow.xaml.cs
using System;
using System.Collections.Generic;
using System.Linq;
using System.Text;
using System.Threading.Tasks;
using System.Windows;
using System.Windows.Controls;
using System.Windows.Data;
using System.Windows.Documents;
using System.Windows.Input;
using System.Windows.Media;
using System.Windows.Media.Imaging;
using System.Windows.Navigation;
using System.Windows.Shapes;
// 以下を追加
using LiveCharts;
using LiveCharts.Wpf;
using LiveCharts.Configurations; // Mappersのため
using LiveCharts.Defaults; // ObservablePointのため

namespace _171124_t1845_logscale
{
    /// <summary>
    /// MainWindow.xaml の相互作用ロジック
    /// </summary>
    public partial class MainWindow : Window
    {
        public MainWindow()
        {
            InitializeComponent();
            graph_init();
        }

        private void graph_init()
        {
            GraphData gd = new GraphData();
            gd.Base = 10;

            var mapper = Mappers.Xy<ObservablePoint>()
                .Y(point => Math.Log(point.Y, gd.Base));

            var sc = new SeriesCollection(mapper)
            {
                new LineSeries
                {
                    Values = new ChartValues<ObservablePoint> {
                        new ObservablePoint(1, 3000),
                        new ObservablePoint(2, 100),
                        new ObservablePoint(3, 40),
                        new ObservablePoint(4, 1),
                    }
                }
            };

            gd.seriesCollection = sc;
            this.DataContext = gd;
        }

        public class GraphData
        {
            public SeriesCollection seriesCollection { get; set; }
            public double Base { get; set; }
        }
    }
}
気づいた点
- ObservablePointを使わないといけない
- Y軸ラベルはLog10(Y)の値になる
- Log10(3000) = 3.477
- Log10(140) = 2.146
- など
- Formatterでべき乗に戻す必要がある (参照: サンプル実装)
