動作環境
Windows 8.1 Pro (64bit)
Microsoft Visual Studio 2017 Community
Sublime Text 2
WPFでグラフを描画するには何が良いか?
LiveChartsというのがあるようだ。
MITライセンス。
リンク
setup
NugetにてプロジェクトにLiveChart.Wpf (v0.9.7)を追加した。
https://lvcharts.net/App/examples/v1/wpf/Install
を参考に以下をXAMLに足す。
(右側のclr-入力時は「wpf」と入力すると補完候補がすぐに見つかる)。
xmlns:lvc="clr-namespace:LiveCharts.Wpf;assembly=LiveCharts.Wpf"
また、code behindでusingを追加する。
// 以下を追加
using LiveCharts;
using LiveCharts.Wpf;
code
以下で動いた。
MainWindow.xaml
<Window x:Class="_171115_t1550_graph.MainWindow"
        xmlns="http://schemas.microsoft.com/winfx/2006/xaml/presentation"
        xmlns:x="http://schemas.microsoft.com/winfx/2006/xaml"
        xmlns:d="http://schemas.microsoft.com/expression/blend/2008"
        xmlns:mc="http://schemas.openxmlformats.org/markup-compatibility/2006"
        xmlns:local="clr-namespace:_171115_t1550_graph"
        xmlns:lvc="clr-namespace:LiveCharts.Wpf;assembly=LiveCharts.Wpf"
        mc:Ignorable="d"
        Title="MainWindow" Height="350" Width="525">
    <Grid>
        <StackPanel>
            <Button Name="B_draw" Height="30" Content="Draw" Click="B_draw_Click"/>
            <lvc:CartesianChart Series="{Binding seriesCollection}" Height="250"/>
        </StackPanel>
    </Grid>
</Window>
MainWindow.xaml.cs
using System;
using System.Collections.Generic;
using System.Linq;
using System.Text;
using System.Threading.Tasks;
using System.Windows;
using System.Windows.Controls;
using System.Windows.Data;
using System.Windows.Documents;
using System.Windows.Input;
using System.Windows.Media;
using System.Windows.Media.Imaging;
using System.Windows.Navigation;
using System.Windows.Shapes;
// 以下を追加
using LiveCharts;
using LiveCharts.Wpf;
namespace _171115_t1550_graph
{
/// <summary>
/// MainWindow.xaml の相互作用ロジック
/// </summary>
public partial class MainWindow : Window
{
public MainWindow()
{
InitializeComponent();
}
//public SeriesCollection SeriesCollection { get; set; }
private void B_draw_Click(object sender, RoutedEventArgs e)
{
GraphData gd = new GraphData();
var sc = new SeriesCollection
{
new LineSeries
{
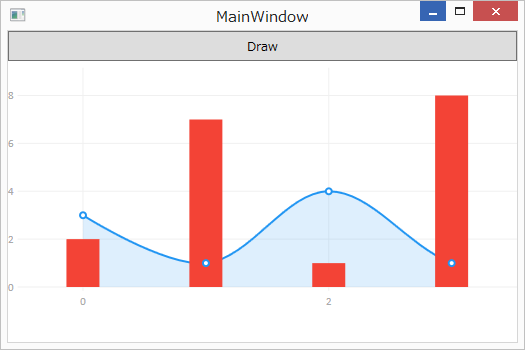
Values = new ChartValues<double> { 3, 1, 4, 1 }
},
new ColumnSeries
{
Values = new ChartValues<double> { 2, 7, 1, 8 }
}
};
gd.seriesCollection = sc;
this.DataContext = gd;
}
public class GraphData
{
public SeriesCollection seriesCollection { get; set; }
}
}
}
code その2
code behindは以下の実装でもいい。
最後のthis.DataContext = this;を忘れると描画されない。
MainWindow.xaml.cs
using System;
using System.Collections.Generic;
using System.Linq;
using System.Text;
using System.Threading.Tasks;
using System.Windows;
using System.Windows.Controls;
using System.Windows.Data;
using System.Windows.Documents;
using System.Windows.Input;
using System.Windows.Media;
using System.Windows.Media.Imaging;
using System.Windows.Navigation;
using System.Windows.Shapes;
// 以下を追加
using LiveCharts;
using LiveCharts.Wpf;

namespace _171115_t1550_graph
{
    /// <summary>
    /// MainWindow.xaml の相互作用ロジック
    /// </summary>
    public partial class MainWindow : Window
    {
        public MainWindow()
        {
            InitializeComponent();

        }

        public SeriesCollection seriesCollection { get; set; }

        private void B_draw_Click(object sender, RoutedEventArgs e)
        {
            seriesCollection = new SeriesCollection
            {
                new LineSeries
                {
                    Values = new ChartValues<double> { 3, 1, 4, 1 }
                },
                new ColumnSeries
                {
                    Values = new ChartValues<double> { 2, 7, 1, 8 }
                }
            };

            this.DataContext = this;
        }
    }
}