TensorFlow
動作環境
GeForce GTX 1070 (8GB)
ASRock Z170M Pro4S [Intel Z170chipset]
Ubuntu 14.04 LTS desktop amd64
TensorFlow v0.11
cuDNN v5.1 for Linux
CUDA v8.0
Python 2.7.6
IPython 5.1.0 -- An enhanced Interactive Python.
gcc (Ubuntu 4.8.4-2ubuntu1~14.04.3) 4.8.4
v0.1 http://qiita.com/7of9/items/8b43357bcaea1f1bce4b
画像を複数表示する時に、1つのページ内の表示数を増やすため、イメージのサイズを調整したいことがある。
answered Nov 29 '10 at 17:30
Pete
fig = matplotlib.pyplot.gcf()
fig.set_size_inches(18.5, 10.5)
fig.savefig('test2png.png', dpi=100)
試してみた。
showIn2D_2image_subplot_each()において、 fig1.set_size_inches(3.14,3.14)としてみた。
in100_out100.ipynb
import numpy as np
import matplotlib.pyplot as plt
import matplotlib.cm as cm
'''
v0.4 Jan. 21, 2017
- set size of figures
v0.3 Jan. 21, 2017
- show 2 images in one figure
v0.2 Jan. 14, 2017
- calcOutput() return in numpy.array
- add saveToCsvFile()
v0.1 Jan. 14, 2017
- add calcOutput()
- add showIn2D()
- show 1d in 2d format
'''
XDIM = 10
YDIM = 10
INDIM = XDIM * YDIM
def saveToCsvFile(data_1d, filename):
wrk_1d = data_1d.reshape(1,INDIM)
np.savetxt(filename, wrk_1d, delimiter=',')
def calcOutput(in_1d):
len_1d = XDIM * YDIM
out_1d = [0.0] * len_1d
for idx in range(0, in_1d.size):
out_1d[idx] = in_1d[len_1d - idx - 1]
return np.array(out_1d)
def showIn2D(data_1d):
# print(data_1d)
data_2d = np.reshape(data_1d, (XDIM, YDIM))
plt.imshow(data_2d, extent=(0, XDIM, 0, YDIM), cmap=cm.gist_rainbow)
plt.show()
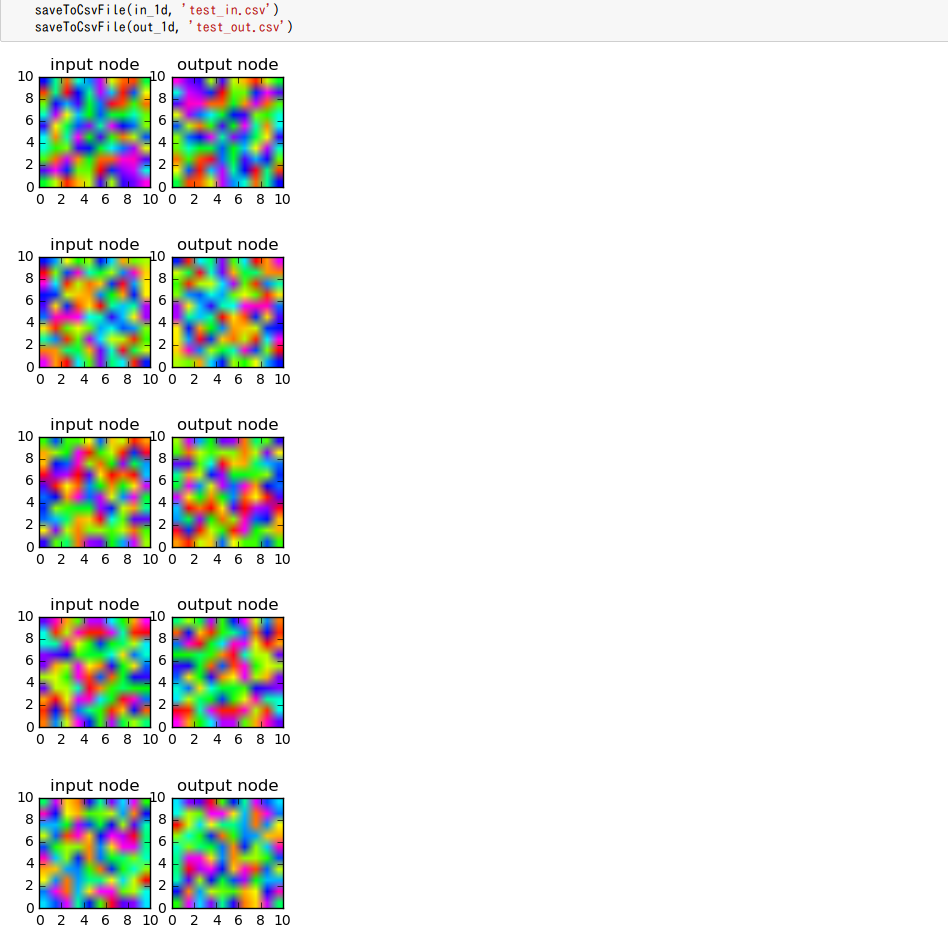
def showIn2D_2image_subplot_each(data1_1d, data2_1d):
data1_2d = np.reshape(data1_1d, (XDIM, YDIM))
data2_2d = np.reshape(data2_1d, (XDIM, YDIM))
fig1 = plt.figure(1)
fig1.set_size_inches(3.14,3.14)
plt.subplot(121)
plt.title('input node')
plt.imshow(data1_2d, extent=(0, XDIM, 0, YDIM), cmap=cm.gist_rainbow)
plt.subplot(122)
plt.title('output node')
plt.imshow(data2_2d, extent=(0, XDIM, 0, YDIM), cmap=cm.gist_rainbow)
plt.show()
def showIn2D_2image_subplot_first(data1_1d, data2_1d):
data1_2d = np.reshape(data1_1d, (XDIM, YDIM))
data2_2d = np.reshape(data2_1d, (XDIM, YDIM))
fig, (axL, axR) = plt.subplots(ncols=2, figsize=(10,4))
axL.imshow(data1_2d, extent=(0, XDIM, 0, YDIM), cmap=cm.gist_rainbow)
axL.grid(True)
axR.imshow(data2_2d, extent=(0, XDIM, 0, YDIM), cmap=cm.gist_rainbow)
axR.grid(True)
fig.show()
if __name__ == '__main__':
for loop in range(5):
in_1d = np.random.rand(INDIM)
out_1d = calcOutput(in_1d)
showIn2D_2image_subplot_each(in_1d, out_1d)
showIn2D_2image_subplot_first(in_1d, out_1d)
saveToCsvFile(in_1d, 'test_in.csv')
saveToCsvFile(out_1d, 'test_out.csv')