0
0

Delete article

Deleted articles cannot be recovered.

Draft of this article would be also deleted.

Are you sure you want to delete this article?

More than 5 years have passed since last update.

Jupyter + Matplotlib > 手順 > 表示された画像を拡大する (解像度はそのまま)

Last updated at Posted at 2018-01-13
動作環境
GeForce GTX 1070 (8GB)
ASRock Z170M Pro4S [Intel Z170chipset]
Ubuntu 16.04 LTS desktop amd64
TensorFlow v1.2.1
cuDNN v5.1 for Linux
CUDA v8.0
Python 3.5.2
IPython 6.0.0 -- An enhanced Interactive Python.
gcc (Ubuntu 5.4.0-6ubuntu1~16.04.4) 5.4.0 20160609
GNU bash, version 4.3.48(1)-release (x86_64-pc-linux-gnu)
scipy v0.19.1
geopandas v0.3.0
MATLAB R2017b (Home Edition)
ADDA v.1.3b6

動機

qiita.png

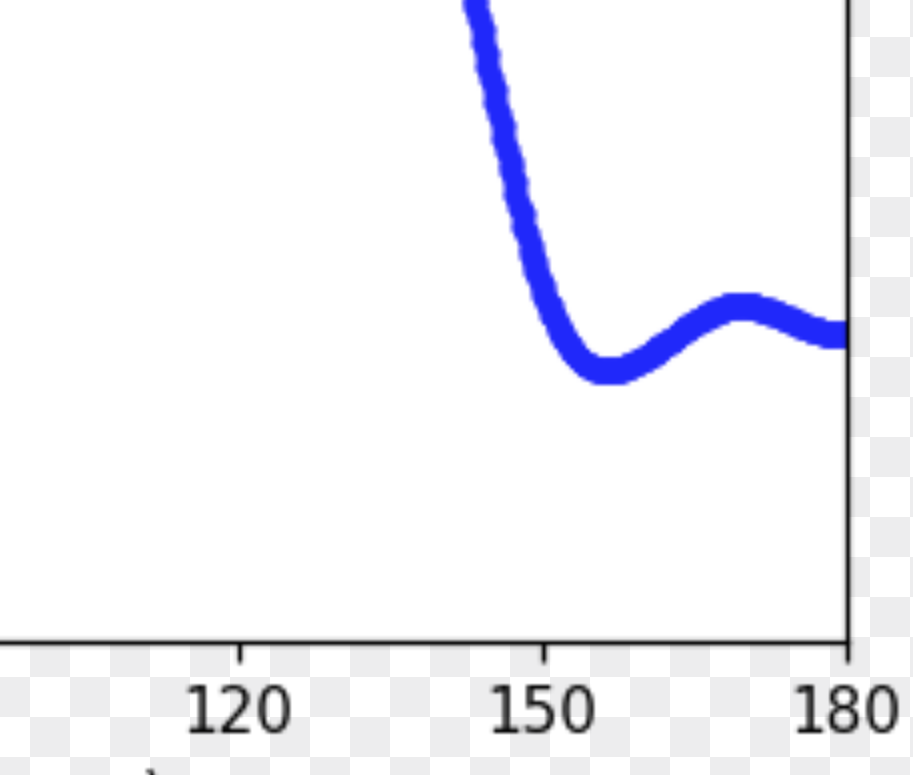
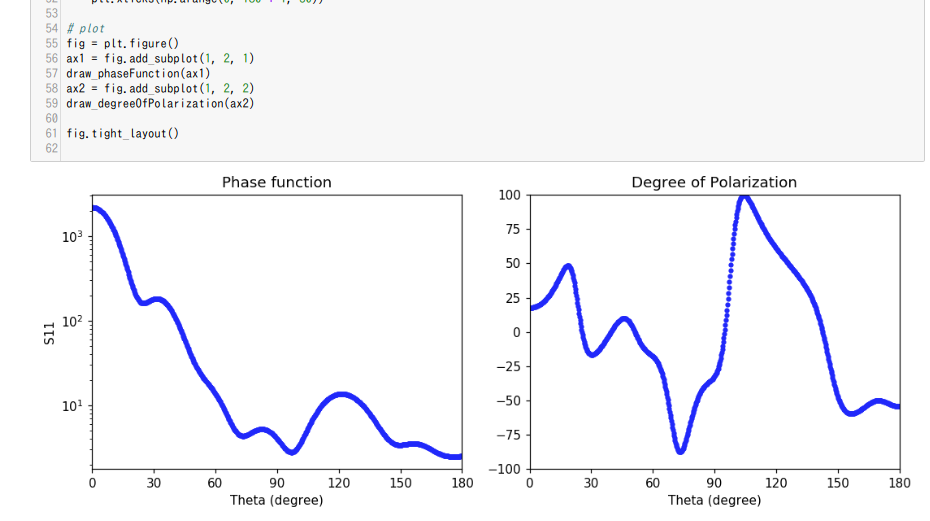
右図のNetagive polarization branch (彗星やC型小惑星の後方散乱で見られる謎の現象)に関係しそうな部分を拡大表示したい。

手順

以下の方法はあるようだ。

  1. Chromeで別ウィンドウを開く
    • 別タブでなく別ウィンドウの方が作業しやすい
  2. Matplotlibの表示画像をドラッグして、手順1のウィンドウにドロップする
    • 背景色が透明の拡大画像表示になる

  3. Ctrl + マウスwheelでさらに拡大する

qiita.png

Jupyter+Matplotlibで表示した状態で「Ctrl + マウスwheel」ではコードセルは拡大表示されるが、グラフは拡大されないので検討した。
解像度は変わらない。
0
0
0

Register as a new user and use Qiita more conveniently

  1. You get articles that match your needs
  2. You can efficiently read back useful information
  3. You can use dark theme
What you can do with signing up
0
0

Delete article

Deleted articles cannot be recovered.

Draft of this article would be also deleted.

Are you sure you want to delete this article?