動作環境
GeForce GTX 1070 (8GB)
ASRock Z170M Pro4S [Intel Z170chipset]
Ubuntu 16.04 LTS desktop amd64
TensorFlow v1.1.0
cuDNN v5.1 for Linux
CUDA v8.0
Python 3.5.2
IPython 6.0.0 -- An enhanced Interactive Python.
gcc (Ubuntu 5.4.0-6ubuntu1~16.04.4) 5.4.0 20160609
GNU bash, version 4.3.48(1)-release (x86_64-pc-linux-gnu)
Ubuntu 14.04 LTSからUbuntu 16.04 LTSに変更してから、Matplotlibの環境が変わったように思う。
一つの変化がfigureが小さくなったこと。
figureを大きくする方法を以下に見つけた。
https://stackoverflow.com/questions/332289/how-do-you-change-the-size-of-figures-drawn-with-matplotlib
元のサイズ
check_result_170722.ipynb
%matplotlib inline

# learning [Exr,Exi,Eyr,Eyi,Ezr,Ezi] from ADDA
# Jul. 22, 2017

import numpy as np
import matplotlib.pyplot as plt

# data1 = np.loadtxt('log_learn.170722_t1133', delimiter=',')
data1 = np.loadtxt('log_learn.170722_t1200', delimiter=',')

input1 = data1[:,0]
output1 = data1[:,1]

fig = plt.figure()
ax1 = fig.add_subplot(2,1,1)

ax1.plot(input1, output1)

ax1.set_xlabel('step')
ax1.set_ylabel('loss')
ax1.set_xlim([0, 90000])
ax1.set_ylim([0, 0.1])
ax1.grid(True)

# fig.show()
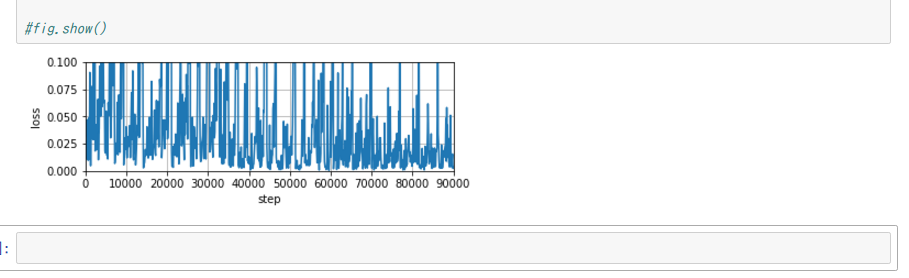
大きくしてみた
check_result_170722.ipynb
%matplotlib inline

# learning [Exr,Exi,Eyr,Eyi,Ezr,Ezi] from ADDA
# Jul. 22, 2017

import numpy as np
import matplotlib.pyplot as plt
from pylab import rcParams

rcParams['figure.figsize'] = 10,10

# data1 = np.loadtxt('log_learn.170722_t1133', delimiter=',')
data1 = np.loadtxt('log_learn.170722_t1200', delimiter=',')

input1 = data1[:,0]
output1 = data1[:,1]

fig = plt.figure()
ax1 = fig.add_subplot(2,1,1)

ax1.plot(input1, output1)

ax1.set_xlabel('step')
ax1.set_ylabel('loss')
ax1.set_xlim([0, 90000])
ax1.set_ylim([0, 0.1])
ax1.grid(True)

# fig.show()
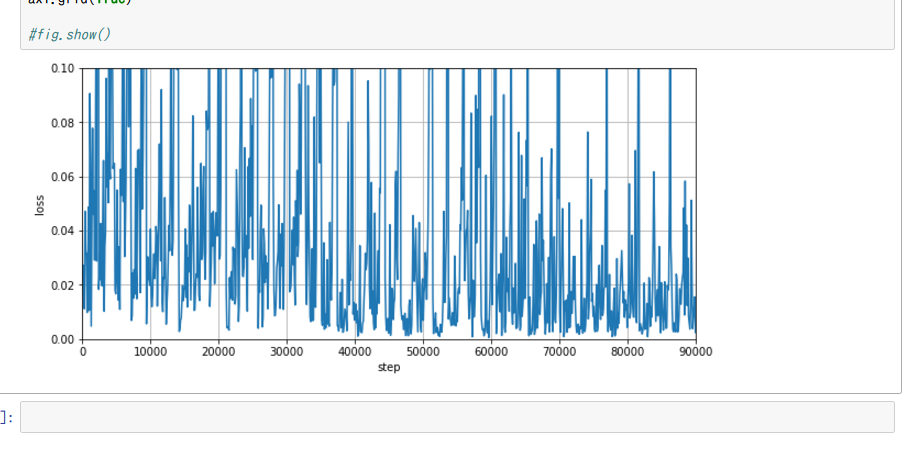
plt.figure()での指定
文字がぼやける件と関して以下を見つけた。
https://github.com/amueller/word_cloud/issues/188
fig = plt.figure(figsize=(10,10),dpi=200)
のようにして、dpiも指定できるようだ。
1200は大きすぎたのでやめて200程度にしてみた。
check_result_170722.ipynb
%matplotlib inline

# learning [Exr,Exi,Eyr,Eyi,Ezr,Ezi] from ADDA
# Jul. 22, 2017

import numpy as np
import matplotlib.pyplot as plt

# data1 = np.loadtxt('log_learn.170722_t1133', delimiter=',')
data1 = np.loadtxt('log_learn.170722_t1200', delimiter=',')

input1 = data1[:,0]
output1 = data1[:,1]

fig = plt.figure(figsize=(10,10),dpi=200)
ax1 = fig.add_subplot(2,1,1)

ax1.plot(input1, output1)

ax1.set_xlabel('step')
ax1.set_ylabel('loss')
ax1.set_xlim([0, 90000])
ax1.set_ylim([0, 0.1])
ax1.grid(True)

# fig.show()
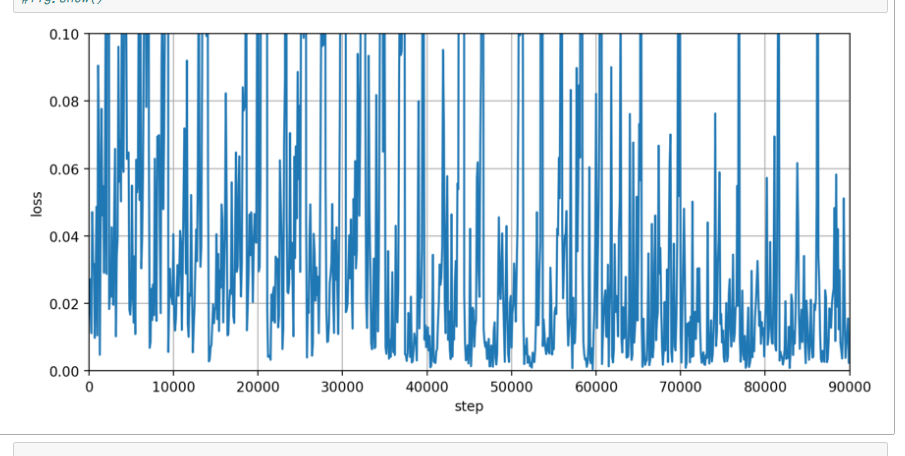
字のぼやけ具合が緩和された。