Environment
GeForce GTX 1070 (8GB)
ASRock Z170M Pro4S [Intel Z170chipset]
Ubuntu 16.04 LTS desktop amd64
TensorFlow v1.2.1
cuDNN v5.1 for Linux
CUDA v8.0
Python 3.5.2
IPython 6.0.0 -- An enhanced Interactive Python.
gcc (Ubuntu 5.4.0-6ubuntu1~16.04.4) 5.4.0 20160609
GNU bash, version 4.3.48(1)-release (x86_64-pc-linux-gnu)
scipy v0.19.1
geopandas v0.3.0
MATLAB R2017b (Home Edition)
ADDA v.1.3b6
This article is related to ADDA (light scattering simulator based on the discrete dipole approximation).
About
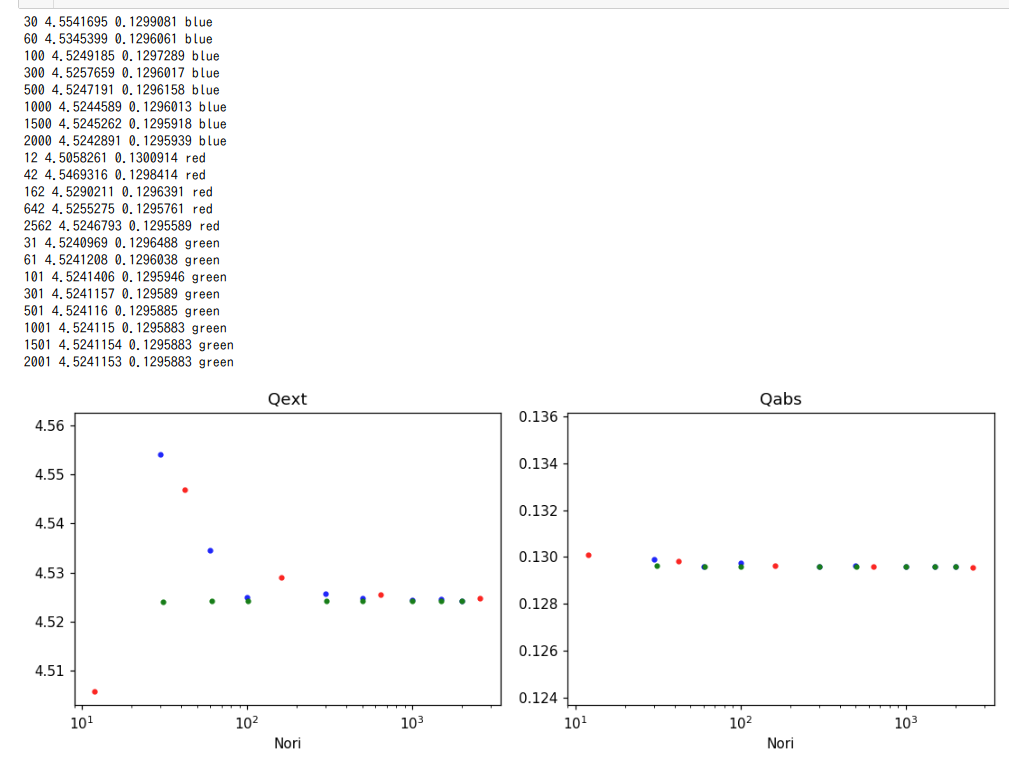
This article introduces a script to show Qext and Qabs as a function of orientations. Qext and Qabs are obtained using ADDA.
Input file
The file named "Qxxx_gHN_N0500" has the following format.
4.5247191  # Qext(avg)
0.1296158  # Qabs(avg)
Qxxx_gHN_N0500 represents the results for Hammersley nodes having 500 points.
code v0.1
The following is the script for Jupyter and Matplotlib.
showNoriQxxx_180217.ipynb
%matplotlib inline
import matplotlib.pyplot as plt
from matplotlib import cm, colors
from mpl_toolkits.mplot3d import Axes3D
from pylab import rcParams
import numpy as np
import time


"""
v0.1 Feb. 17, 2018
  - remove [PICKUP_THETA_IDX]
  - remove read_s11_and_polarization()
  - add read_Qext_Qabs()
  - IN_FILES[] has results for [Qext] and [Qabs]
  - branched from [showNoriQxxx_180203.ipynb]
---
v0.3 Feb. 17, 2018
  - IN_FILES[] has results for [Fibonacci nodes]
v0.2 Feb. 11, 2018
  - turn off [text labels]
  - show in different colors for different node sets
      + draw_asANumberOfOrientations() takes [colors] arg
      + add get_colorsOfNodes()
      + IN_FILES[] has results for [Icosahedral nodes]
      + add Nori_clrs[]
v0.1 Feb. 03, 2018
  - draw_asANumberOfOrientations() draws [Nori] text
  - add draw_asANumberOfOrientations()
  - add get_numberOfOrientations()
  - remove draw_degreeOfPolarization()
  - remove draw_phaseFunction()
  - branched from [showQxxx_180113]
---
v0.6 Jan. 28, 2018
  - fix bug > read_s11_and_polarization() was reading [IN_FILE] not [infile]
v0.5 Jan. 20, 2018
  - read list of files defined at IN_FILES[]
  - add read_s11_and_polarization()
  - change from [scatter plot] to [line plot]
v0.4 Jan. 14, 2018
  - refactor > remove_outsideOf() > use Boolean indexing
  - refactor > use set_xticks() instead of plt.xticks()
v0.3 Jan. 13, 2018
  - show enlarged version (3rd and 4th graph)
    + add remove_outsideOf()
v0.2 Jan. 13, 2018
  - show [degree of polarization]
v0.1 Jan. 13, 2018
  - set x axis ticks to 30 degree
  - show [S11] as a function of [Theta]
"""

# Coding rule:PEP8

rcParams['figure.figsize'] = 10, 7
rcParams['figure.dpi'] = 110


def read_Qext_Qabs(infile):
    dat = np.genfromtxt(infile, delimiter=' ')
    return dat


def remove_outsideOf(xs, ys, xmin, xmax):
    xns, yns = np.array(xs), np.array(ys)
    keep_flgs = (xns >= xmin) & (xns <= xmax)
    return xns[keep_flgs], yns[keep_flgs]


IN_FILES = [
    # 1234567890123456
    # 1. Hammersley Nodes
    'Qxxx_gHN_N0030',
    'Qxxx_gHN_N0060',
    'Qxxx_gHN_N0100',
    'Qxxx_gHN_N0300',
    'Qxxx_gHN_N0500',
    'Qxxx_gHN_N1000',
    'Qxxx_gHN_N1500',
    'Qxxx_gHN_N2000',
    # 2. Icosahedral Nodes (type=0)
    'Qxxx_gIN_N0012',
    'Qxxx_gIN_N0042',
    'Qxxx_gIN_N0162',
    'Qxxx_gIN_N0642',
    'Qxxx_gIN_N2562',
    # 3. Fibonacci Nodes
    'Qxxx_gFN_N0031',
    'Qxxx_gFN_N0061',
    'Qxxx_gFN_N0101',
    'Qxxx_gFN_N0301',
    'Qxxx_gFN_N0501',
    'Qxxx_gFN_N1001',
    'Qxxx_gFN_N1501',
    'Qxxx_gFN_N2001',
]  # from ADDA


def get_colorsOfNodes(filename):
    if "gHN" in filename:
        return 'blue'
    if "gIN" in filename:
        return "red"
    if "gFN" in filename:
        return "green"
    return "gray"


def get_numberOfOrientations(filename):
    return int(filename[-4:])  # -4: e.g. _N0030


def draw_asANumberOfOrientations(ax, numOris, vals, colors, atitle=''):
    ax.set_xscale("log")
    ax.set_title(atitle)
    for xpos, ypos, aclr in zip(numOris, vals, colors):
        ax.scatter(xpos, ypos, color=aclr, marker='.')
    ax.set_xlabel('Nori')
    # for xpos, ypos in zip(numOris, s11s):
    #    # 0.1:arbitrary to adjust text position
    #    ax.text(xpos, ypos + 0.1, str(xpos), rotation=45.0)

# Store values
numOris = []  # Nori (Number of orientations)
Nori_qext = []  # Qext as a function of Nori(Number of orientations)
Nori_qabs = []  # Qabs as a function of Nori(Number of orientations)
Nori_clrs = []  # colors of the plot
for afile in IN_FILES:
    # thetas, s11s, pols = read_s11_and_polarization(afile)
    Qext, Qabs = read_Qext_Qabs(afile)
    numOris += [get_numberOfOrientations(afile)]
    Nori_qext += [Qext]
    Nori_qabs += [Qabs]
    Nori_clrs += [get_colorsOfNodes(afile)]
    print(numOris[-1], Nori_qext[-1], Nori_qabs[-1], Nori_clrs[-1])

# Plot
fig = plt.figure()
ax1a = fig.add_subplot(2, 2, 1)
draw_asANumberOfOrientations(ax1a, numOris, Nori_qext, Nori_clrs, 'Qext')
ax1b = fig.add_subplot(2, 2, 2)
draw_asANumberOfOrientations(ax1b, numOris, Nori_qabs, Nori_clrs, 'Qabs')

fig.tight_layout()
Results