動作環境
GeForce GTX 1070 (8GB)
ASRock Z170M Pro4S [Intel Z170chipset]
Ubuntu 16.04 LTS desktop amd64
TensorFlow v1.2.1
cuDNN v5.1 for Linux
CUDA v8.0
Python 3.5.2
IPython 6.0.0 -- An enhanced Interactive Python.
gcc (Ubuntu 5.4.0-6ubuntu1~16.04.4) 5.4.0 20160609
GNU bash, version 4.3.48(1)-release (x86_64-pc-linux-gnu)
scipy v0.19.1
geopandas v0.3.0
MATLAB R2017b (Home Edition)
ADDA v.1.3b6
処理概要
Jupyter + Matplotlib のADDA粒子形状表示コードにおいて、進捗が分からないのでどれくらい待てばよいか分からない。
@QUANON さんによるカウントダウン表示の方法を使って、progressを表示するようにしてみた。
with 文と @contextlib.contextmanager が便利
準備
- 上記リンク先の「もうひとつの例」にあるcountdown.pyの@contextlib.contextmanager
def overwriting():以下を取り入れる- oneline_print()という名前に変更しました
- 時間のかかる処理の関数内にprogress用print文を記載する
msg = "%.4f " % (idx/len(xps)) + "%"print(msg) # progress
- 時間のかかる処理の関数を
with oneline_print():追加で呼ぶ
code
Jupyter code
(Note: こちらで用意したファイル(IntField-Y)がないと実行はできません)
showParticleShape_180107.ipynb
import matplotlib.pyplot as plt
from matplotlib import cm, colors
from mpl_toolkits.mplot3d import Axes3D
from pylab import rcParams
import numpy as np
import time
import contextlib
"""
v0.6 Jan. 08, 2018
- print progress of the processing using the contextmanager
- add using_oneline_print()
v0.5 Jan. 07, 2018
- rename to [showParticleShape_18017.ipynb]
+ was [showChebyshev_170910.ipynb]
v0.4 Sep. 10, 2017
- read ADDA file [IntField-Y]
v0.3 Sep. 10, 2017
- set colors in X direction
- increase number of spheres to 3000
v0.2 Sep. 10, 2017
- show 8 spheres
- lower the resolution of the sphere (from 100j to 6j)
v0.1 Sep. 10, 2017
- show 2 spheres
"""
# coding rule: PEP8
rcParams['figure.figsize'] = 15, 10
# reference
# https://stackoverflow.com/questions/31768031/plotting-points-on-the-surface-of-a-sphere-in-pythons-matplotlib
# Reference:
# countdown.py at
# https://qiita.com/QUANON/items/c5868b6c65f8062f5876
# by @QUANON
@contextlib.contextmanager
def oneline_print():
import sys
original_write = sys.stdout.write # keep the original function
def overwrite(text):
# delete from the cursor position to the end of line
original_write('\033[K')
original_write('\r') # move to the beginning of line
# remove new line at the end from the text and print()
original_write(text.rstrip('\n'))
sys.stdout.write = overwrite # replace the function
try:
yield
finally:
sys.stdout.write = original_write # set the original function
print('*** [sys.stdout.write] is now the original')
def plot_spheres(xps, yps, zps):
for idx, elem in enumerate(zip(xps, yps, zps)):
axp, ayp, azp = elem
if idx % 10 == 0:
# print progress
msg = "%.2f " % (idx / len(xps) * 100) + "%"
print(msg) # progress
dx = x + axp
dy = y + ayp
dz = z + azp
ax.plot_surface(
dx, dy, dz, rstride=1, cstride=1, color='c',
alpha=1.0, linewidth=0,
# 50: arbitrary chosen to set colors
facecolors=plt.cm.Set2((dx - 0) / (50 - 0)))
start_time = time.time()
# Create a sphere
r = 1
pi = np.pi
cos = np.cos
sin = np.sin
phi, theta = np.mgrid[0.0:pi:6j, 0.0:2.0*pi:6j]
x = r*sin(phi)*cos(theta)
y = r*sin(phi)*sin(theta)
z = r*cos(phi)
# read from ADDA file
INPFILE = 'IntField-Y'
SHIFT_POS = 10.0
dat = np.genfromtxt(INPFILE, delimiter=' ', skip_header=1)
xpar, ypar, zpar = [], [], []
for elem in dat:
axp, ayp, azp = elem[:3]
# 3.0: arbitrary chosen to adjust sphere positions
xpar += [(axp + SHIFT_POS) * 3.0]
ypar += [(ayp + SHIFT_POS) * 3.0]
zpar += [(azp + SHIFT_POS) * 3.0]
# Set colours and render
fig = plt.figure()
ax = fig.add_subplot(111, projection='3d')
SKIP_NUM = 2
xp = xpar[::SKIP_NUM]
yp = ypar[::SKIP_NUM]
zp = zpar[::SKIP_NUM]
with oneline_print():
plot_spheres(xp, yp, zp)
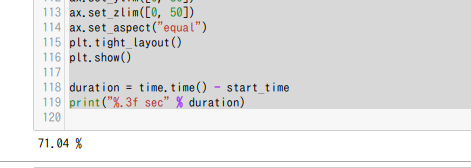
ax.set_xlim([0, 50])
ax.set_ylim([0, 50])
ax.set_zlim([0, 50])
ax.set_aspect("equal")
plt.tight_layout()
plt.show()
duration = time.time() - start_time
print("%.3f sec" % duration)
実行例
処理中
終了後
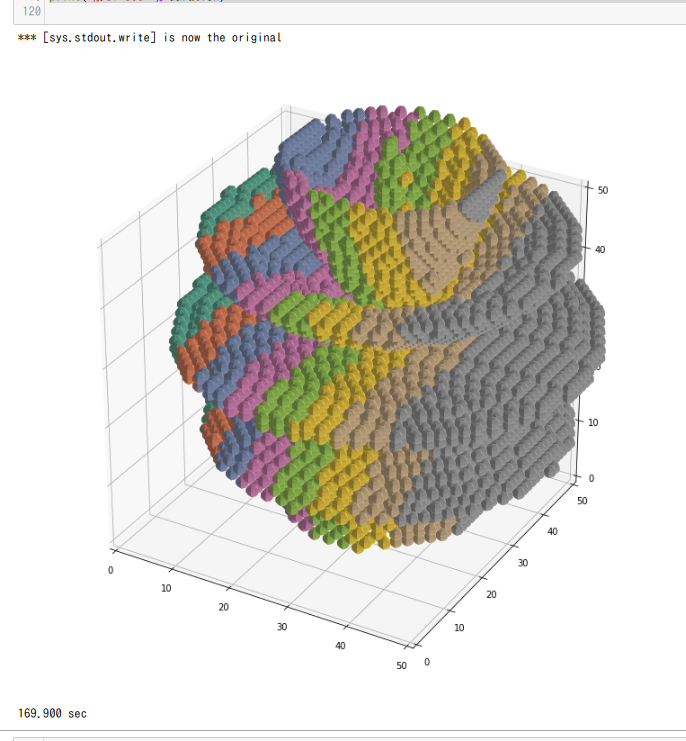
progressがパーセント表示され、どれくらい待てばよいか分かるようになった。
これで、待ち時間に別の作業ができる。