動作環境
Windows 8.1 Pro (64bit)
Microsoft Visual Studio 2017 Community
Sublime Text 2
処理内容
- Seriesの可視を設定する
参考
code
上記のリンク先ではチェックボックスなどの処理が実装されている。
将来使いそうな実装である。
下記ではもっとシンプルな設定をする。
MainWindow.xaml
<Window x:Class="_171124_t1800_visibility.MainWindow"
        xmlns="http://schemas.microsoft.com/winfx/2006/xaml/presentation"
        xmlns:x="http://schemas.microsoft.com/winfx/2006/xaml"
        xmlns:d="http://schemas.microsoft.com/expression/blend/2008"
        xmlns:mc="http://schemas.openxmlformats.org/markup-compatibility/2006"
        xmlns:local="clr-namespace:_171124_t1800_visibility"
        xmlns:lvc="clr-namespace:LiveCharts.Wpf;assembly=LiveCharts.Wpf"
        mc:Ignorable="d"
        Title="MainWindow" Height="350" Width="525">
    <Window.Resources>
        <BooleanToVisibilityConverter x:Key="bvc"></BooleanToVisibilityConverter>
    </Window.Resources>
    <Grid>
        <StackPanel>
            <Button Name="B_show1" Click="B_show1_Click"
                Height="30" Width="100" Content="show1"/>
            <Button Name="B_show2" Click="B_show2_Click"
                Height="30" Width="100" Content="show2"/>
            <lvc:CartesianChart Height="250">
                <lvc:CartesianChart.Series>
                    <lvc:LineSeries Values="{Binding Line1Values}"
                                Visibility="{Binding Line1Visible, Converter={StaticResource bvc}}"/>
                    <lvc:LineSeries Values="{Binding Line2Values}"
                                Visibility="{Binding Line2Visible, Converter={StaticResource bvc}}"/>
                </lvc:CartesianChart.Series>
            </lvc:CartesianChart>
        </StackPanel>
    </Grid>
</Window>
MainWindow.xaml.cs
using System;
using System.Collections.Generic;
using System.Linq;
using System.Text;
using System.Threading.Tasks;
using System.Windows;
using System.Windows.Controls;
using System.Windows.Data;
using System.Windows.Documents;
using System.Windows.Input;
using System.Windows.Media;
using System.Windows.Media.Imaging;
using System.Windows.Navigation;
using System.Windows.Shapes;
// 以下を追加した
using LiveCharts;
using LiveCharts.Wpf;
using System.ComponentModel;

namespace _171124_t1800_visibility
{
    /// <summary>
    /// MainWindow.xaml の相互作用ロジック
    /// </summary>
    public partial class MainWindow : Window
    {
        public MainWindow()
        {
            InitializeComponent();
            graph_init();
        }
        private void graph_init()
        {
            gd = new GraphData();
            gd.Line1Values = new ChartValues<double> { 3, 1, 4, 1 };
            gd.Line2Values = new ChartValues<double> { 2, 7, 1, 8 };
            // 以下はDataContext設定前だけ有効
            gd.Line1Visible = true;
            gd.Line2Visible = false;
            this.DataContext = gd;
        }

        GraphData gd;
        public class GraphData : INotifyPropertyChanged
        {
            public event PropertyChangedEventHandler PropertyChanged;
            protected virtual void OnPropertyChanged(string propertyName = null)
            {
                if (PropertyChanged != null)
                    PropertyChanged.Invoke(this, new PropertyChangedEventArgs(propertyName));
            }

            public ChartValues<double> Line1Values { get; set; }
            public ChartValues<double> Line2Values { get; set; }
            public bool Line1Visible { get; set; }
            public bool Line2Visible { get; set; }
        }

        private void B_show1_Click(object sender, RoutedEventArgs e)
        {
            // ここでは動作しない。
            // 動作させるにはBindingにして、INotifyPropertyChangedやプロパティのsetを指定する
            gd.Line2Visible = true;
        }

        private void B_show2_Click(object sender, RoutedEventArgs e)
        {
            // 下記の方法は正しいやり方ではないと思う。
            this.DataContext = null;
            gd.Line2Visible = true;
            this.DataContext = gd;
        }
    }
}
注意点
show1ボタンの処理では可視設定は機能しない。
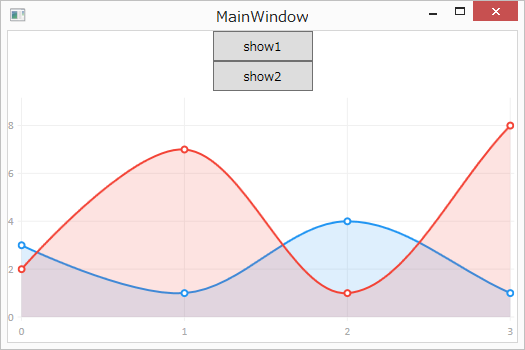
show2ボタンの処理で可視設定が機能することを確認した。こちらは正当な方法ではないだろう。
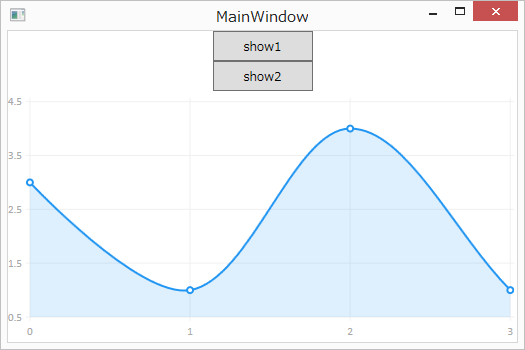
起動時。
show2押下後。