GeForce GTX 1070 (8GB)
ASRock Z170M Pro4S [Intel Z170chipset]
Ubuntu 16.04 LTS desktop amd64
TensorFlow v1.2.1
cuDNN v5.1 for Linux
CUDA v8.0
Python 3.5.2
IPython 6.0.0 -- An enhanced Interactive Python.
gcc (Ubuntu 5.4.0-6ubuntu1~16.04.4) 5.4.0 20160609
GNU bash, version 4.3.48(1)-release (x86_64-pc-linux-gnu)
scipy v0.19.1
geopandas v0.3.0
MATLAB R2017b (Home Edition)
ADDA v.1.3b6
This article is related to ADDA (light scattering simulator based on the discrete dipole approximation).
ADDA:Links of related codes
About
In this article, I show the tool to show the Mueller matrix elements ([Phase function] and [Degree of polarization]) by reading from the file [Mueller] obtained using the ADDA.
Requirement
The code uses Jupyter and Matplotlib. These components are required.
For Ubuntu 16.04 LTS, the installation procedure is available at the GitHub.
Note: Considering the influence of the Meltdown and Spectre as of January 08, 2018, the Ubuntu 16.04 LTS needs to be patched for the security. The security patching procedure is not written here
Code v0.1-v0.4
%matplotlib inline
import matplotlib.pyplot as plt
from matplotlib import cm, colors
from mpl_toolkits.mplot3d import Axes3D
from pylab import rcParams
import numpy as np
import time


"""
v0.4 Jan. 14, 2018
  - refactor > remove_outsideOf() > use Boolean indexing
  - refactor > use set_xticks() instead of plt.xticks()
v0.3 Jan. 13, 2018
  - show enlarged version (3rd and 4th graph)
    + add remove_outsideOf()
v0.2 Jan. 13, 2018
  - show [degree of polarization]
v0.1 Jan. 13, 2018
  - set x axis ticks to 30 degree
  - show [S11] as a function of [Theta]
"""

# Coding rule:PEP8

rcParams['figure.figsize'] = 10, 4
rcParams['figure.dpi'] = 110

IN_FILE = 'mueller'  # obtained from ADDA

# read from file
dat = np.genfromtxt(IN_FILE, delimiter=' ', skip_header=1)
thetas = []
s11s = []
pols = []
for elem in dat:
    thetas += [elem[0]]
    s11s += [elem[1]]
    pols += [-elem[2] / elem[1] * 100]


def remove_outsideOf(xs, ys, xmin, xmax):
    xns, yns = np.array(xs), np.array(ys)
    keep_flgs = (xns >= xmin) & (xns <= xmax)
    return xns[keep_flgs], yns[keep_flgs]


def draw_phaseFunction(ax, xmin=0, xmax=180):
    stepx = 30
    title = 'Phase function'
    if 180 - xmin < 90:
        stepx = 5
        title += ' (enlarged)'
    xs, ys = remove_outsideOf(thetas, s11s, xmin, xmax)
    ax.scatter(xs, ys, color='blue', marker='.')
    ax.set_yscale('log')
    ax.set_xlabel('Scattering angle (degree)')
    ax.set_ylabel('S11')
    ax.set_xlim(xmin, xmax)
    ax.set_title(title)
    ax.set_xticks(np.arange(xmin, xmax + 1, stepx))


def draw_degreeOfPolarization(ax, xmin=0, xmax=180):
    stepx = 30
    title = 'Degree of Polarization'
    if xmax - xmin < 90:
        stepx = 5
        title += ' (enlarged)'
    xs, ys = remove_outsideOf(thetas, pols, xmin, xmax)
    ax.scatter(xs, ys, color='blue', marker='.')
    ax.set_xlabel('Scattering angle (degree)')
    ax.set_xlim(xmin, xmax)
    ax.set_ylim(np.min(ys), np.max(ys))
    ax.set_title(title)
    ax.set_xticks(np.arange(xmin, xmax + 1, stepx))

# plot
fig = plt.figure()

ax1a = fig.add_subplot(2, 2, 1)
draw_phaseFunction(ax1a)
ax1b = fig.add_subplot(2, 2, 3)
draw_phaseFunction(ax1b, xmin=150, xmax=180)

ax2a = fig.add_subplot(2, 2, 2)
draw_degreeOfPolarization(ax2a)
ax2b = fig.add_subplot(2, 2, 4)
draw_degreeOfPolarization(ax2b, xmin=150, xmax=180)

fig.tight_layout()
Result
For this example, the configuration of the ADDA is as follows:
Generated by ADDA v.1.3b6
command: './adda -orient 0.0 90.0 3.965 -grid 104 -shape chebyshev 0.7 12 -m 1.5 0.005 -eq_rad 6.299605 -store_int_field '
Obtained figures are as follows:

code v0.5
The code is modified as follows:
- show lineplot instead of scatterplot
- to compare results
- read multiple files
%matplotlib inline
import matplotlib.pyplot as plt
from matplotlib import cm, colors
from mpl_toolkits.mplot3d import Axes3D
from pylab import rcParams
import numpy as np
import time


"""
v0.5 Jan. 20, 2018
  - read list of files defined at IN_FILES[]
  - add read_s11_and_polarization()
  - change from [scatter plot] to [line plot]
v0.4 Jan. 14, 2018
  - refactor > remove_outsideOf() > use Boolean indexing
  - refactor > use set_xticks() instead of plt.xticks()
v0.3 Jan. 13, 2018
  - show enlarged version (3rd and 4th graph)
    + add remove_outsideOf()
v0.2 Jan. 13, 2018
  - show [degree of polarization]
v0.1 Jan. 13, 2018
  - set x axis ticks to 30 degree
  - show [S11] as a function of [Theta]
"""

# Coding rule:PEP8

rcParams['figure.figsize'] = 10, 4
rcParams['figure.dpi'] = 110

def read_s11_and_polarization(infile):
    dat = np.genfromtxt(IN_FILE, delimiter=' ', skip_header=1)
    thetas = []
    s11s = []
    pols = []
    for elem in dat:
        thetas += [elem[0]]
        s11s += [elem[1]]
        pols += [-elem[2] / elem[1] * 100]
    return thetas, s11s, pols


def remove_outsideOf(xs, ys, xmin, xmax):
    xns, yns = np.array(xs), np.array(ys)
    keep_flgs = (xns >= xmin) & (xns <= xmax)
    return xns[keep_flgs], yns[keep_flgs]


def draw_phaseFunction(ax, thetas, s11s, alabel, xmin=0, xmax=180):
    stepx = 30
    title = 'Phase function'
    if 180 - xmin < 90:
        stepx = 5
        title += ' (enlarged)'
    xs, ys = remove_outsideOf(thetas, s11s, xmin, xmax)
    #ax.scatter(xs, ys, color='blue', marker='.')
    ax.plot(xs, ys, label=alabel)
    ax.legend()

    ax.set_yscale('log')
    ax.set_xlabel('Scattering angle (degree)')
    ax.set_ylabel('S11')
    ax.set_xlim(xmin, xmax)
    ax.set_title(title)
    ax.set_xticks(np.arange(xmin, xmax + 1, stepx))


def draw_degreeOfPolarization(ax, xmin=0, xmax=180):
    stepx = 30
    title = 'Degree of Polarization'
    if xmax - xmin < 90:
        stepx = 5
        title += ' (enlarged)'
    xs, ys = remove_outsideOf(thetas, pols, xmin, xmax)
    #ax.scatter(xs, ys, color='blue', marker='.')
    ax.plot(xs, ys)

    ax.set_xlabel('Scattering angle (degree)')
    ax.set_xlim(xmin, xmax)
    ax.set_ylim(np.min(ys), np.max(ys))
    ax.set_title(title)
    ax.set_xticks(np.arange(xmin, xmax + 1, stepx))

IN_FILES = [
    'mueller_gHN_N0030',
    'mueller_gHN_N0500',
] # from ADDA

# plot
fig = plt.figure()

for afile in IN_FILES:
    thetas, s11s, pols = read_s11_and_polarization(afile)
    ax1a = fig.add_subplot(2, 2, 1)
    draw_phaseFunction(ax1a, thetas, s11s, alabel=afile)
    ax1b = fig.add_subplot(2, 2, 3)
    draw_phaseFunction(ax1b, thetas, s11s, alabel=afile, xmin=150, xmax=180)

    ax2a = fig.add_subplot(2, 2, 2)
    draw_degreeOfPolarization(ax2a)
    ax2b = fig.add_subplot(2, 2, 4)
    draw_degreeOfPolarization(ax2b, xmin=150, xmax=180)

fig.tight_layout()

code v0.6
- v0.6
- fix bug > read_s11_and_polarization() read [IN_FILE] instead of [infile]
%matplotlib inline
import matplotlib.pyplot as plt
from matplotlib import cm, colors
from mpl_toolkits.mplot3d import Axes3D
from pylab import rcParams
import numpy as np
import time


"""
v0.6 Jan. 28, 2018
  - fix bug > read_s11_and_polarization() was reading [IN_FILE] not [infile]
v0.5 Jan. 20, 2018
  - read list of files defined at IN_FILES[]
  - add read_s11_and_polarization()
  - change from [scatter plot] to [line plot]
v0.4 Jan. 14, 2018
  - refactor > remove_outsideOf() > use Boolean indexing
  - refactor > use set_xticks() instead of plt.xticks()
v0.3 Jan. 13, 2018
  - show enlarged version (3rd and 4th graph)
    + add remove_outsideOf()
v0.2 Jan. 13, 2018
  - show [degree of polarization]
v0.1 Jan. 13, 2018
  - set x axis ticks to 30 degree
  - show [S11] as a function of [Theta]
"""

# Coding rule:PEP8

rcParams['figure.figsize'] = 10, 4
rcParams['figure.dpi'] = 110

def read_s11_and_polarization(infile):
    dat = np.genfromtxt(infile, delimiter=' ', skip_header=1)
    thetas = []
    s11s = []
    pols = []
    for elem in dat:
        thetas += [elem[0]]
        s11s += [elem[1]]
        pols += [-elem[2] / elem[1] * 100]
    return thetas, s11s, pols


def remove_outsideOf(xs, ys, xmin, xmax):
    xns, yns = np.array(xs), np.array(ys)
    keep_flgs = (xns >= xmin) & (xns <= xmax)
    return xns[keep_flgs], yns[keep_flgs]


def draw_phaseFunction(ax, thetas, s11s, alabel, xmin=0, xmax=180):
    stepx = 30
    title = 'Phase function'
    if 180 - xmin < 90:
        stepx = 5
        title += ' (enlarged)'
    xs, ys = remove_outsideOf(thetas, s11s, xmin, xmax)
    #ax.scatter(xs, ys, color='blue', marker='.')
    ax.plot(xs, ys, label=alabel)
    ax.legend()

    ax.set_yscale('log')
    ax.set_xlabel('Scattering angle (degree)')
    ax.set_ylabel('S11')
    ax.set_xlim(xmin, xmax)
    ax.set_title(title)
    ax.set_xticks(np.arange(xmin, xmax + 1, stepx))


def draw_degreeOfPolarization(ax, xmin=0, xmax=180):
    stepx = 30
    title = 'Degree of Polarization'
    if xmax - xmin < 90:
        stepx = 5
        title += ' (enlarged)'
    xs, ys = remove_outsideOf(thetas, pols, xmin, xmax)
    #ax.scatter(xs, ys, color='blue', marker='.')
    ax.plot(xs, ys)

    ax.set_xlabel('Scattering angle (degree)')
    ax.set_xlim(xmin, xmax)
    ax.set_ylim(np.min(ys), np.max(ys))
    ax.set_title(title)
    ax.set_xticks(np.arange(xmin, xmax + 1, stepx))

IN_FILES = [
    'mueller_gHN_N0030',
    'mueller_gHN_N0500',
] # from ADDA

# plot
fig = plt.figure()

for afile in IN_FILES:
    thetas, s11s, pols = read_s11_and_polarization(afile)
    ax1a = fig.add_subplot(2, 2, 1)
    draw_phaseFunction(ax1a, thetas, s11s, alabel=afile)
    ax1b = fig.add_subplot(2, 2, 3)
    draw_phaseFunction(ax1b, thetas, s11s, alabel=afile, xmin=150, xmax=180)

    ax2a = fig.add_subplot(2, 2, 2)
    draw_degreeOfPolarization(ax2a)
    ax2b = fig.add_subplot(2, 2, 4)
    draw_degreeOfPolarization(ax2b, xmin=150, xmax=180)

fig.tight_layout()

code v0.7
- change [figure.figsize] for larger height
%matplotlib inline
import matplotlib.pyplot as plt
from matplotlib import cm, colors
from mpl_toolkits.mplot3d import Axes3D
from pylab import rcParams
import numpy as np
import time
"""
v0.7 Feb. 11, 2018
- change [figure.figsize] for larger height
v0.6 Jan. 28, 2018
- fix bug > read_s11_and_polarization() was reading [IN_FILE] not [infile]
v0.5 Jan. 20, 2018
- read list of files defined at IN_FILES[]
- add read_s11_and_polarization()
- change from [scatter plot] to [line plot]
v0.4 Jan. 14, 2018
- refactor > remove_outsideOf() > use Boolean indexing
- refactor > use set_xticks() instead of plt.xticks()
v0.3 Jan. 13, 2018
- show enlarged version (3rd and 4th graph)
+ add remove_outsideOf()
v0.2 Jan. 13, 2018
- show [degree of polarization]
v0.1 Jan. 13, 2018
- set x axis ticks to 30 degree
- show [S11] as a function of [Theta]
"""
# Coding rule:PEP8
rcParams['figure.figsize'] = 10, 7
rcParams['figure.dpi'] = 110
def read_s11_and_polarization(infile):
dat = np.genfromtxt(infile, delimiter=' ', skip_header=1)
thetas = []
s11s = []
pols = []
for elem in dat:
thetas += [elem[0]]
s11s += [elem[1]]
pols += [-elem[2] / elem[1] * 100]
return thetas, s11s, pols
def remove_outsideOf(xs, ys, xmin, xmax):
xns, yns = np.array(xs), np.array(ys)
keep_flgs = (xns >= xmin) & (xns <= xmax)
return xns[keep_flgs], yns[keep_flgs]
def draw_phaseFunction(ax, thetas, s11s, alabel, xmin=0, xmax=180):
stepx = 30
title = 'Phase function'
if 180 - xmin < 90:
stepx = 5
title += ' (enlarged)'
xs, ys = remove_outsideOf(thetas, s11s, xmin, xmax)
#ax.scatter(xs, ys, color='blue', marker='.')
ax.plot(xs, ys, label=alabel)
ax.legend()
ax.set_yscale('log')
ax.set_xlabel('Scattering angle (degree)')
ax.set_ylabel('S11')
ax.set_xlim(xmin, xmax)
ax.set_title(title)
ax.set_xticks(np.arange(xmin, xmax + 1, stepx))
def draw_degreeOfPolarization(ax, xmin=0, xmax=180):
stepx = 30
title = 'Degree of Polarization'
if xmax - xmin < 90:
stepx = 5
title += ' (enlarged)'
xs, ys = remove_outsideOf(thetas, pols, xmin, xmax)
#ax.scatter(xs, ys, color='blue', marker='.')
ax.plot(xs, ys)
ax.set_xlabel('Scattering angle (degree)')
ax.set_xlim(xmin, xmax)
ax.set_ylim(np.min(ys), np.max(ys))
ax.set_title(title)
ax.set_xticks(np.arange(xmin, xmax + 1, stepx))
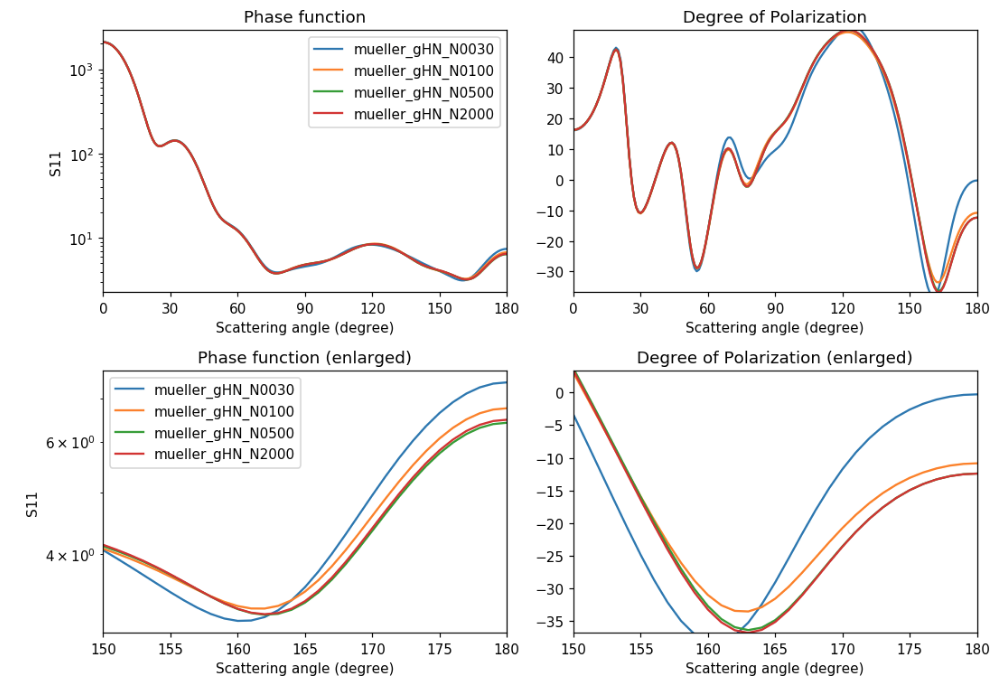
IN_FILES = [
'mueller_gHN_N0030',
'mueller_gHN_N0100',
'mueller_gHN_N0500',
'mueller_gHN_N2000',
# 'mueller_gIN_N0642',
] # from ADDA
# plot
fig = plt.figure()
for afile in IN_FILES:
thetas, s11s, pols = read_s11_and_polarization(afile)
ax1a = fig.add_subplot(2, 2, 1)
draw_phaseFunction(ax1a, thetas, s11s, alabel=afile)
ax1b = fig.add_subplot(2, 2, 3)
draw_phaseFunction(ax1b, thetas, s11s, alabel=afile, xmin=150, xmax=180)
ax2a = fig.add_subplot(2, 2, 2)
draw_degreeOfPolarization(ax2a)
ax2b = fig.add_subplot(2, 2, 4)
draw_degreeOfPolarization(ax2b, xmin=150, xmax=180)
fig.tight_layout()