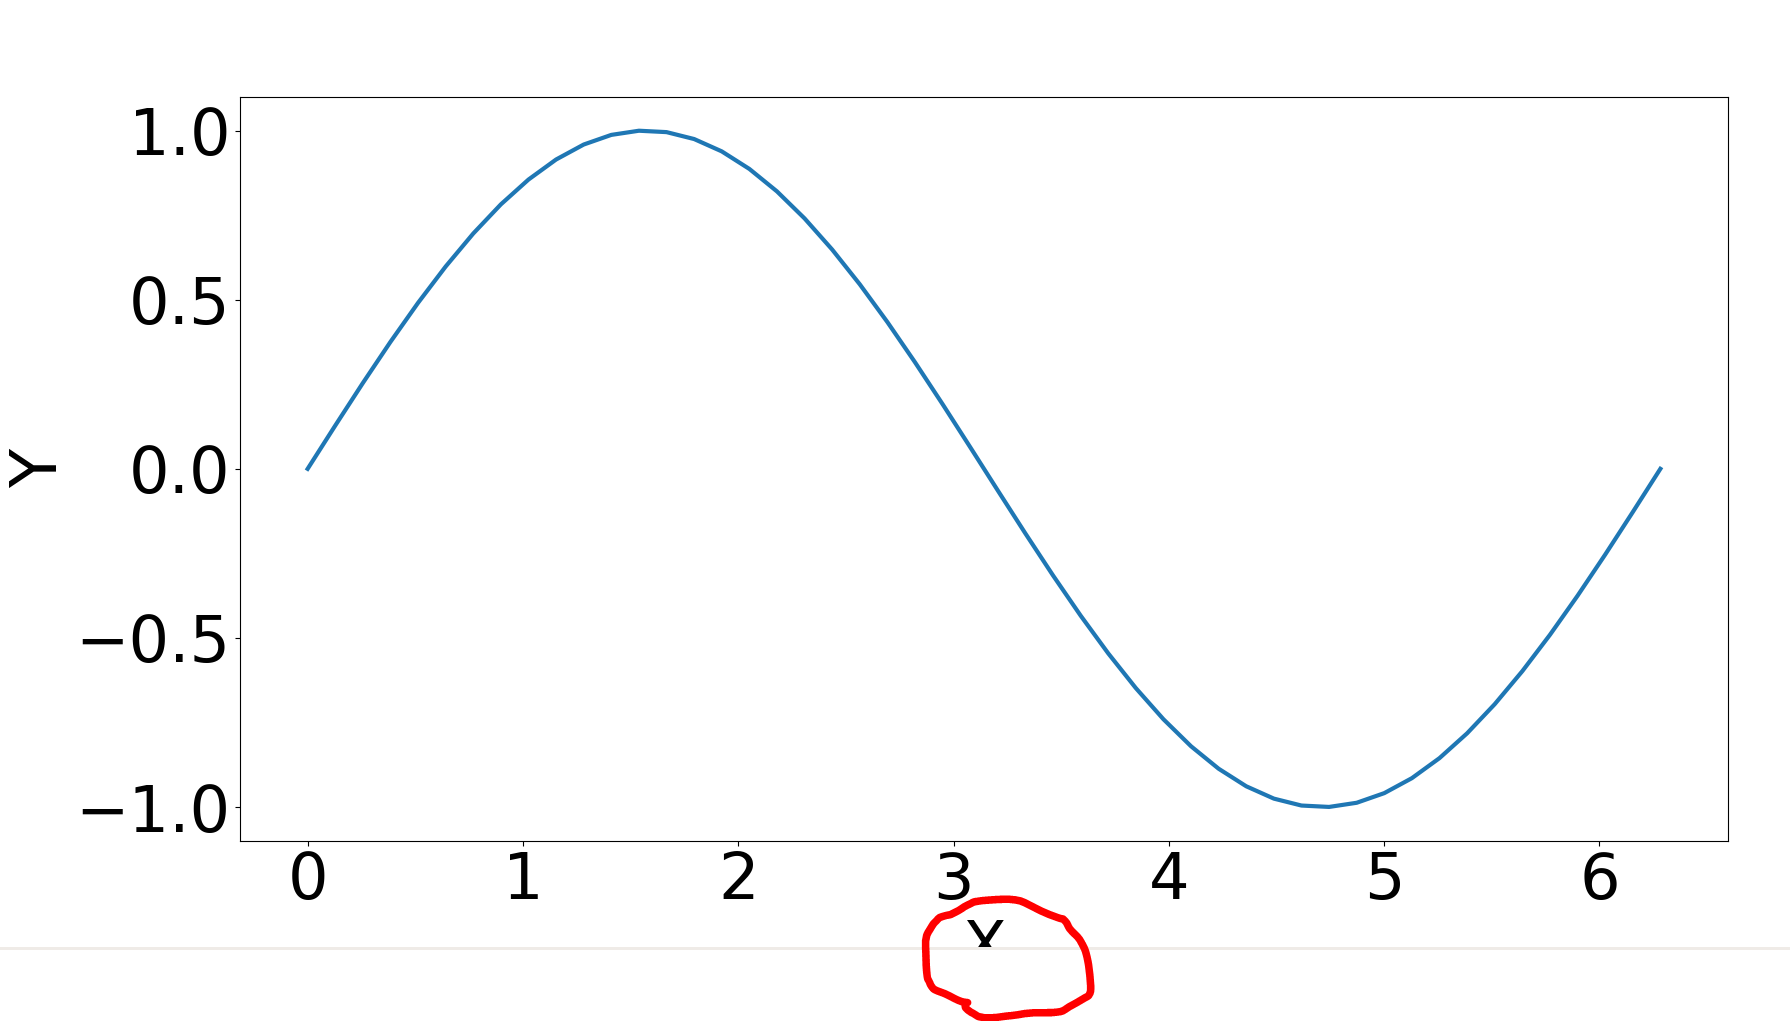
Matplotlibを使っていて普段はラベルの文字に問題ないが、スライド用や論文用に文字サイズを大きくすると、x軸のラベルが見切れてしまうことがある。
よく遭遇する問題だがピンポイントに解説している記事が調べた限り見つからないので書き残しておく
見切れる例
import numpy as np
import matplotlib.pyplot as plt

plt.rcParams['font.size'] = 46
plt.rcParams['lines.linewidth'] = 3
x = np.linspace(0, 2 * np.pi)
y = np.sin(x)
plt.plot(x, y)
plt.xlabel("X")
plt.ylabel("Y")
plt.show()
赤丸つけたところが見切れている。
見切れなくする
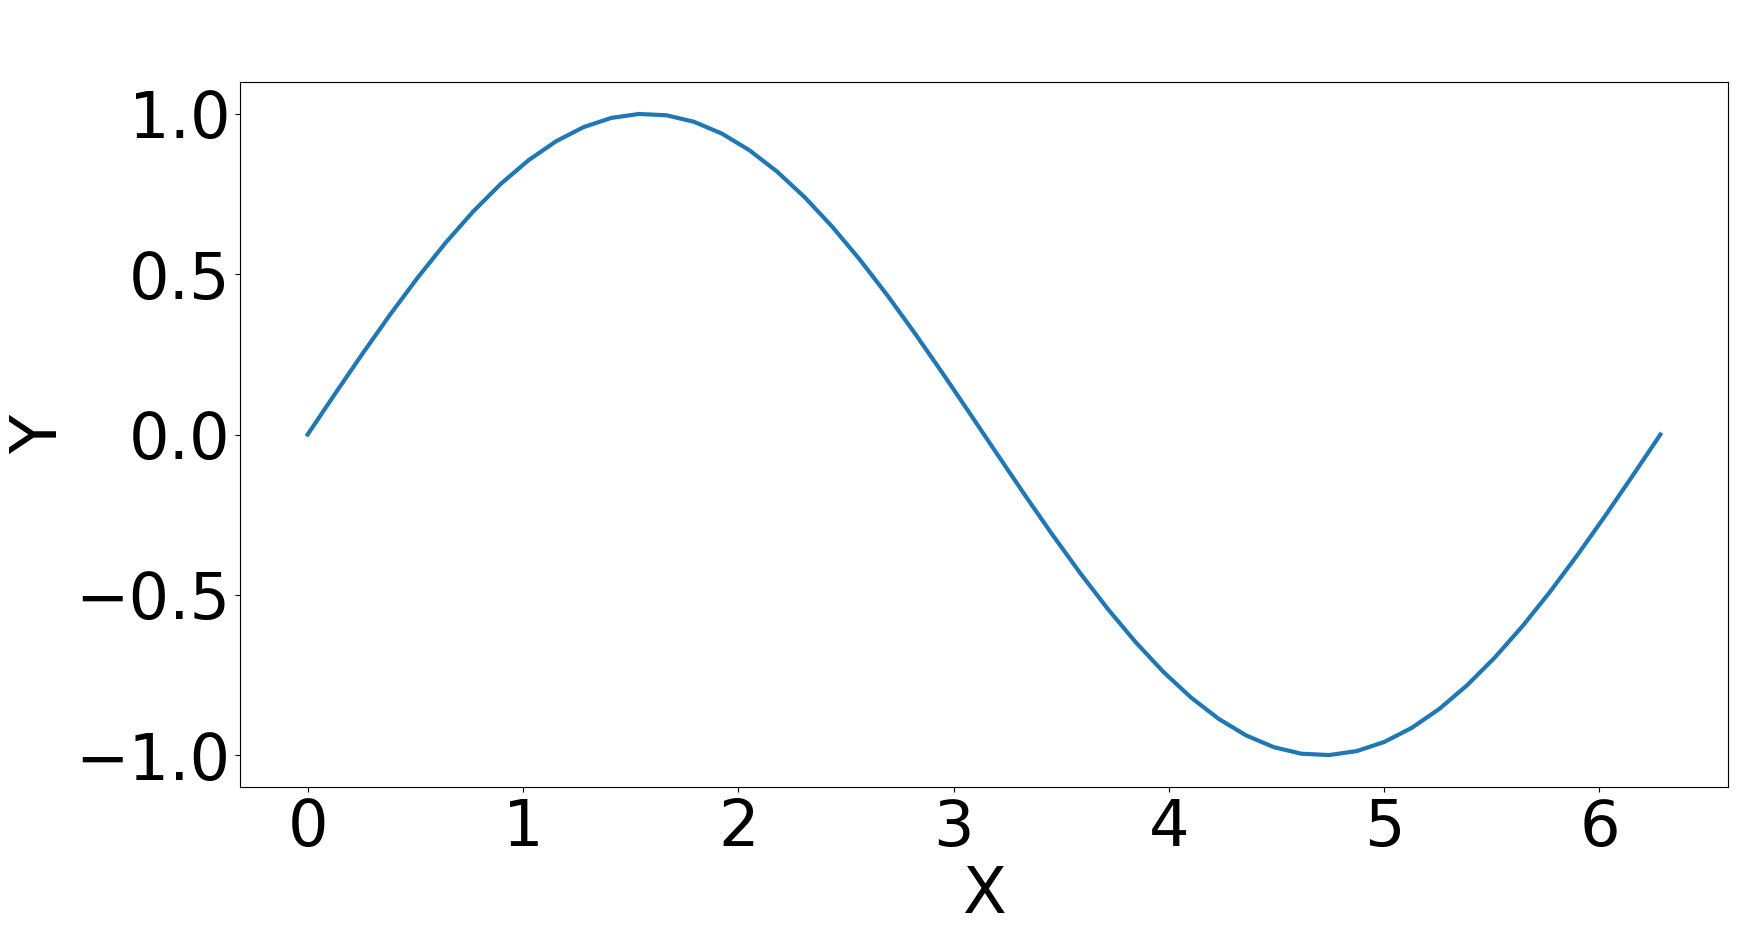
グラフの描写範囲の設定を変えることでx軸のラベルを見きれない用にできる。
グラフの描写範囲の下限の設定は、matplotlib.pyplot.rcParams['figure.subplot.bottom'] に格納されている。これがデフォルトだと0.11になっていて、下から11%の領域までグラフが描かれてしまうため、x軸のラベルが入り切らない。これを15%(0.15)くらいに変更すればいい。
import numpy as np
import matplotlib.pyplot as plt

plt.rcParams['font.size'] = 46
# 次の一行を書いておく
plt.rcParams['figure.subplot.bottom'] = 0.15
plt.rcParams['lines.linewidth'] = 3
x = np.linspace(0, 2 * np.pi)
y = np.sin(x)
plt.plot(x, y)
plt.xlabel("X")
plt.ylabel("Y")
plt.show()

