はじめに
Kaggleの登竜門と言われる、タイタニック号の生存者予測をやってみました。概要は乗客の年齢や性別、船席の等級などから生存者を予測を行い、正解率を競うものです。ちなみに、正解率が一番高い参加者は100%を誇っています。すげぇ。。。
まずはゴールの確認
kaggleに参加するには、会員登録が必要なのでそれらを済ませて、まずは目指すべきゴールを確認します。
▼ゴール
各乗客が生き残ったかどうかを予測する
▼最終的なアウトプット
以下2列の項目にて、ヘッダーと418名のデータセットを作成する
・PassengerId
・Survived (1=生存,0=死亡)
▼データ項目
| Variable | Definition | Key |
|---|---|---|
| survival | Survival | 0 = No, 1 = Yes |
| pclass | Ticket class | 1 = 1st, 2 = 2nd, 3 = 3rd |
| sex | Sex | |
| Age | Age in years | |
| sibsp | # of siblings / spouses aboard the Titanic | |
| parch | # of parents / children aboard the Titanic | |
| ticket | Ticket number | |
| fare | Passenger fare | |
| cabin | Cabin number | |
| embarked | Port of Embarkation | C = Cherbourg, Q = Queenstown, S = Southampton |
データセットダウンロード
以下のページより、2つのデータをダウンロードします。
test.csv
train.csv
https://www.kaggle.com/c/titanic/data
データの確認
まずはデータのデータの前処理と可視化を行うためのライブラリをインポートし、CSVファイルを読み込みます。
import pandas as pd
import numpy as np
df = pd.read_csv('train.csv')

import matplotlib.pyplot as plt
import seaborn as sns
%matplotlib inline
▼ざっくりとデータの全体像を把握します
項目やデータ形式の確認
df.head()

基本的な統計量の確認
df.describe()

ヒストグラムを作成
df.hist(figsize = (12,12))

各項目の相関関係を可視化
:titanic.py
plt.figure(figsize = (15,15))
sns.heatmap(df.corr(),annot = True)

試しに性別と目的変数の関係を可視化
sns.countplot('Sex' , hue = 'Survived',data = df)

女性の生存率が、男性に比べるとかなり高いことがわかります。
データの前処理
欠損値処理とカテゴリ変数の置換
# 各行・列ごとに欠損値を一つでも含むか確認
df.isnull().sum()

from sklearn.model_selection import  train_test_split
# 欠損値処理
df['Fare'] = df['Fare'].fillna(df['Fare'].median())
df['Age'] = df['Age'].fillna(df['Age'].median())
df['Embarked'] = df['Embarked'].fillna('S')

# カテゴリ変数の変換
df['Sex'] = df['Sex'].apply(lambda x: 1 if x == 'male' else 0)
df['Embarked'] = df['Embarked'].map( {'S': 0 , 'C':1 , 'Q':2}).astype(int)

# 不要なcolumnを削除
df = df.drop(['Cabin','Name','PassengerId','Ticket'],axis =1)

# 学習データとテストデータに分割
train_X = df.drop('Survived',axis = 1)
train_y = df.Survived
(train_X , test_X , train_y , test_y) = train_test_split(train_X, train_y , test_size = 0.3 , random_state = 0)
機械学習の実装
今回は決定木とランダムフォレストで予測を行いたいと思います。
決定木
from sklearn.tree import DecisionTreeClassifier
clf = DecisionTreeClassifier(random_state = 0)
clf = clf.fit(train_X , train_y)
pred = clf.predict(test_X)

# 正解率の算出
from sklearn.metrics import (roc_curve , auc ,accuracy_score)
pred = clf.predict(test_X)
fpr, tpr, thresholds = roc_curve(test_y , pred,pos_label = 1)
auc(fpr,tpr)
accuracy_score(pred,test_y)
正解率は
0.77985074626865669
ランダムフォレスト
ランダムフォレストの実施
from sklearn.ensemble import RandomForestClassifier
clf = RandomForestClassifier(n_estimators = 10,max_depth=5,random_state = 0)
clf = clf.fit(train_X , train_y)
pred = clf.predict(test_X)
fpr, tpr , thresholds = roc_curve(test_y,pred,pos_label = 1)
auc(fpr,tpr)
accuracy_score(pred,test_y)
正解率は
0.82835820895522383
予測結果の提出
先程作成したランダムフォレストの予測モデルをもとに、テストデータを予測しファイルの提出を行います。
fin = pd.read_csv('test.csv')
fin.head()

passsengerid = fin['PassengerId']
fin.isnull().sum()
fin['Fare'] = fin['Fare'].fillna(fin['Fare'].median())
fin['Age'] = fin['Age'].fillna(fin['Age'].median())
fin['Embarked'] = fin['Embarked'].fillna('S')

# カテゴリ変数の変換
fin['Sex'] = fin['Sex'].apply(lambda x: 1 if x == 'male' else 0)
fin['Embarked'] = fin['Embarked'].map( {'S': 0 , 'C':1 , 'Q':2}).astype(int)

# 不要なcolumnを削除
fin= fin.drop(['Cabin','Name','Ticket','PassengerId'],axis =1)
# ランダムフォレストで予測
predictions = clf.predict(fin)

submission = pd.DataFrame({'PassengerId':passsengerid, 'Survived':predictions})
submission.to_csv('submission.csv' , index = False)
結果
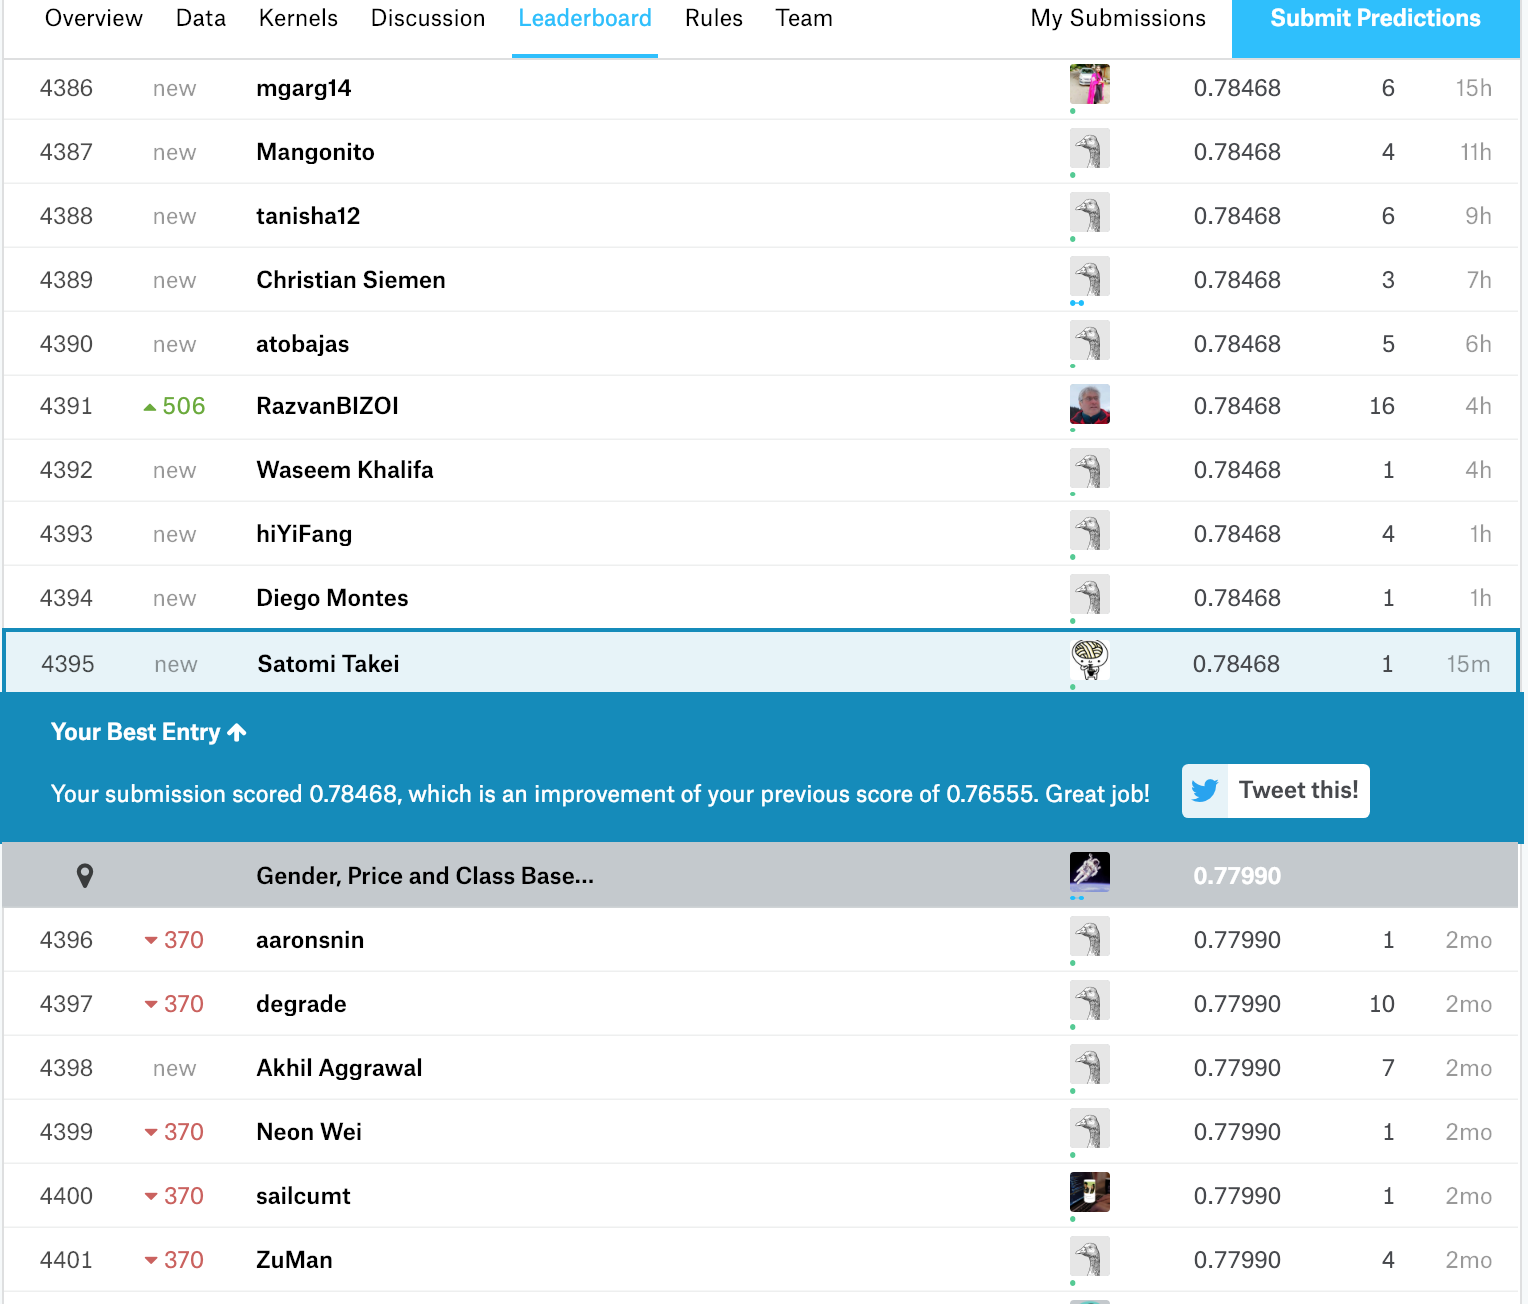
テストデータでのスコアは、0.78468で4395位、上位42%らしいです。

今後、他のアルゴリズムでの予測やパラメーターチューニングによる精度向上を目指したいと思います。