本記事の目的
Prometheus IPMI Exporter を使って、遠隔マシン(ipmi_exporter プロセスが起動していない監視対象のサーバ)の IPMI 情報を Prometheus サーバで収集する方法を解説します。
公式の GitHub リポジトリの README.md を読めば、ipmi_exporter プロセスを起動したローカルマシンから IPMI 情報を収集することは難しくありません。しかし、遠隔マシンを監視対象とするときの設定方法が分かりにくかったため、自身の備忘録も兼ねて本記事を書くことにしました。
- この記事に含まれるもの:
- Prometheus サーバの最低限の起動方法
- Prometheus IPMI Exporter の最低限の起動方法
- Prometheus IPMI Exporter で遠隔マシンから IPMI 情報を取得するための設定の詳細
- この記事に含まれないもの:
- Prometheus に関する詳細な解説
遠隔マシンの IPMI 情報を取得する
本記事では、Prometheus サーバと監視対象サーバの2台の構成で、Prometheus サーバに Prometheus と Prometheus IPMI Exporter の両プロセスを起動、監視対象サーバの IPMI 情報を Prometheus サーバで収集することにします。

遠隔マシンの IPMI 情報を取得するためには、Prometheus と Prometheus IPMI Exporter 、それぞれに設定ファイルが必要になるので、それらの中身について解説します。
-
Prometheus:
- prometheus.yml
- target_ipmi.yml
-
Prometheus IPMI Exporter:
- ipmi_remote.yml
Prometheus IPMI Exporter とは
Prometheus IPMI Exporter は、起動されたローカルマシン、もしくは遠隔マシンの IPMI 情報を収集し、Prometheus サーバに対してデータを開示します。Prometheus は定期的に Prometheus IPMI Exporter へアクセスし、収集した各種データを一元管理します。
- Prometheus (https://github.com/prometheus/prometheus)
- Prometheus IPMI Exporter (https://github.com/prometheus-community/ipmi_exporter)
事前準備
Prometheus サーバと監視対象サーバは、OSが既にインストールされており、IPアドレスが適切に設定され、互いに通信可能である前提とします。
1. Prometheus サーバに Prometheus をインストール
-
適当な場所に適当な作業フォルダ(例えば prometheus/)を作成し、移動します。
4shi1o@ubuntu:~$ mkdir prometheus
4shi1o@ubuntu:~$ cd prometheus
4shi1o@ubuntu:~/prometheus$
```
-
Prometheus 公式サイトのダウンロード から、最新のバイナリをダウンロードします。
4shi1o@ubuntu:~/prometheus$ wget https://github.com/prometheus/prometheus/releases/download/v2.31.1/prometheus-2.31.1.linux-amd64.tar.gz
```
-
ダウンロードした tar.gz ファイルを解凍します。
4shi1o@ubuntu:~/prometheus$ tar xfz prometheus-2.31.1.linux-amd64.tar.gz
```
2. Prometheus サーバに Prometheus IPMI Exporter をインストール
-
適当な場所に適当な作業フォルダ(例えば prometheus/)を作成し、移動します。
4shi1o@ubuntu:~$ mkdir ipmi_exporter
4shi1o@ubuntu:~$ cd ipmi_exporter
4shi1o@ubuntu:~/ipmi_exporter$
```
-
prometheus-community/ipmi_exporter の GitHub プロジェクト から最新リリースのバイナリをダウンロードします。
4shi1o@ubuntu:~/ipmi_exporter$ wget https://github.com/prometheus-community/ipmi_exporter/releases/download/v1.4.0/ipmi_exporter-1.4.0.linux-amd64.tar.gz -
ダウンロードした tar.gz ファイルを解凍します。
4shi1o@ubuntu:~/ipmi_exporter$ tar xfz ipmi_exporter-1.4.0.linux-amd64.tar.gz
```
3. freeipmi のインストール
Prometheus IPMI Exporter は、IPMI 情報の収集に freeipmi コマンドを実行するため、あらかじめインストールが必要です。
4shi1o@ubuntu:~$ sudo apt install freeipmi
遠隔マシンの IPMI 情報を取得するための設定ファイル
-
Prometheus: prometheus.yml
prometheus.yml は、下記 2 つの場所で紹介されているサンプルを組み合わせて作成します。
-
Prometheus の Getting started ドキュメント に記載されているサンプル
-
scrape_intervalに特別なこだわりがなければ、サンプルをそのまま利用します。 - デフォルトで、Prometheus プロセスは、
9090ポートで起動します。
-
-
Prometheus IPMI Exporter の Configuration ドキュメント に記載されているサンプル
修正すべき箇所が 2 つあります。
-
file_sd_configs内のfilesで指定するファイル名およびパス: 今回の例では、ipmi_targets.yml と指定します。 -
separator内のreplacementで指定する Prometheus IPMI Exporter が起動する IP アドレスとポート番号の組み合わせ: 今回の例では、localhost:9290と指定します。
-
-
global:
  scrape_interval: 15s

scrape_configs:
  - job_name: "prometheus"
    scrape_interval: 5s
    static_configs:
      - targets: ["localhost:9090"]

# ここまで: Prometheus の Gettubg started ドキュメントのサンプルを利用
# ここから: Prometheus IPMI Exporter の Configuration ドキュメントのサンプルを利用

  - job_name: "ipmi"
    params:
      module: ['default']
    scrape_interval: 30s
    scrape_timeout: 15s
    metrics_path: /ipmi
    scheme: http
    file_sd_configs:
    - files:
      - ipmi_targets.yml
      refresh_interval: 5m
    relabel_configs:
    - source_labels: [__address__]
      separator: ;
      regex: (.*)
      target_label: __param_target
      replacement: ${1}
      action: replace
    - source_labels: [__param_target]
      separator: ;
      regex: (.*)
      target_label: instance
      replacement: ${1}
      action: replace
    - separator: ;
      regex: .*
      target_label: __address__
      replacement: localhost:9290
      action: replace
-
Prometheus: ipmi_targets.yml
ipmi_targets.yml は、下記サンプルを利用します。
-
Prometheus IPMI Exporter の Configuration ドキュメント に記載されているサンプル
-
targetsで指定する IP アドレスは、監視対象マシンの IP アドレスに修正してください。
-
-
Prometheus IPMI Exporter の Configuration ドキュメント に記載されているサンプル
---
- targets:
  - 10.1.2.23    # 例えば、これが監視対象マシンの IP アドレスだとする
  labels:
    job: ipmi_exporter
-
Prometheus IPMI Exporter: ipmi_remote.yml
ipmi_remote.yml は、下記サンプルを利用します。
-
Prometheus IPMI Exporter の ipmi_remote.yml
- 各
module内に記載されているuserとpassを監視対象マシンの IPMI ユーザ、パスワードに修正してください。 - 今回の例では、
defaultモジュールのみ実行するので、他のモジュールに関する設定は削除していますが、そのまま残しておいても問題ありません。
- 各
-
Prometheus IPMI Exporter の ipmi_remote.yml
modules:
        default:
                # These settings are used if no module is specified, the
                # specified module doesn't exist, or of course if
                # module=default is specified.
                user: "default_user"
                pass: "example_pw"
                # The below settings correspond to driver-type, privilege-level, and
                # session-timeout respectively, see `man 5 freeipmi.conf` (and e.g.
                # `man 8 ipmi-sensors` for a list of driver types).
                driver: "LAN_2_0"
                privilege: "user"
                # The session timeout is in milliseconds. Note that a scrape can take up
                # to (session-timeout * #-of-collectors) milliseconds, so set the scrape
                # timeout in Prometheus accordingly.
                timeout: 10000
                # Available collectors are bmc, ipmi, chassis, dcmi, sel, and sm-lan-mode
                # If _not_ specified, bmc, ipmi, chassis, and dcmi are used
                collectors:
                - bmc
                - ipmi
                - chassis
                # Got any sensors you don't care about? Add them here.
                exclude_sensor_ids:
                - 2
                - 29
                - 32
                - 50
                - 52
                - 55
実際に実行してみる
-
prometheus.yml, ipmi_targets.yml を適当なフォルダ(例:~/prometheus/prometheus-2.31.1.linux-amd64)に配置
-
ipmi_remote.yml を適当なフォルダ(例:~/ipmi_exporter/ipmi_exporter-1.4.0.linux-amd64)に配置
-
Prometheus を prometheus.yml ファイルを参照する形の sudo 権限で起動
4shi1o@ubuntu:~$ cd prometheus/prometheus-2.31.1.linux-amd64
4shi1o@ubuntu:~/prometheus/prometheus-2.31.1.linux-amd64$ sudo ./prometheus --config.file prometheus.yml
...(起動ログが流れる)...
ts=2021-11-24T03:56:20.718Z caller=main.go:811 level=info msg="Server is ready to receive web requests."
```
-
Prometheus IPMI Exporter を ipmi_remote.yml を参照する形の sudo 権限で起動
4shi1o@ubuntu:~$ cd ipmi_exporter/ipmi_exporter-1.4.0.linux-amd64
4shi1o@ubuntu:~/ipmi_exporter/ipmi_exporter-1.4.0.linux-amd64$ sudo ./ipmi_exporter --config.file=ipmi_remote.yml
INFO[0000] Starting ipmi_exporter source="main.go:83"
INFO[0000] Loaded config file ipmi_remote.yml source="config.go:234"
INFO[0000] Listening on :9290 source="main.go:147"
```
-
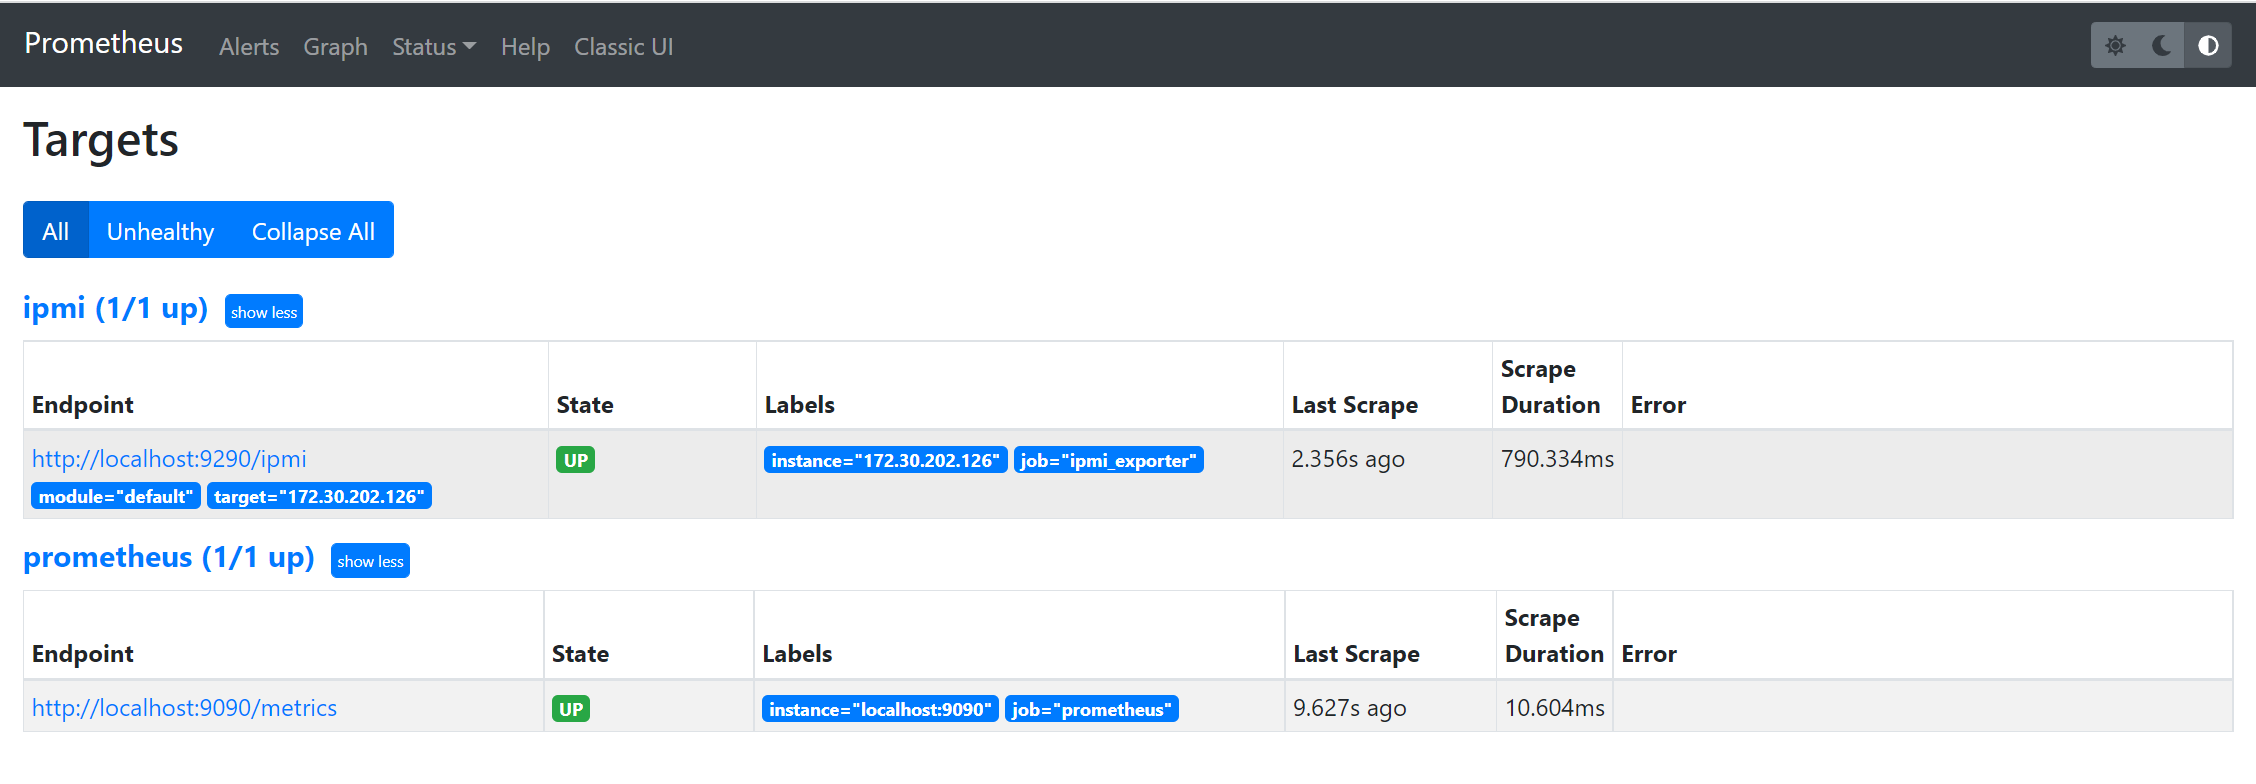
ブラウザで Prometheus サーバの 9090 ポートへアクセス
-
Targets タブで、ipmi のエンドポイントのステータスが "up" であることを確認する。
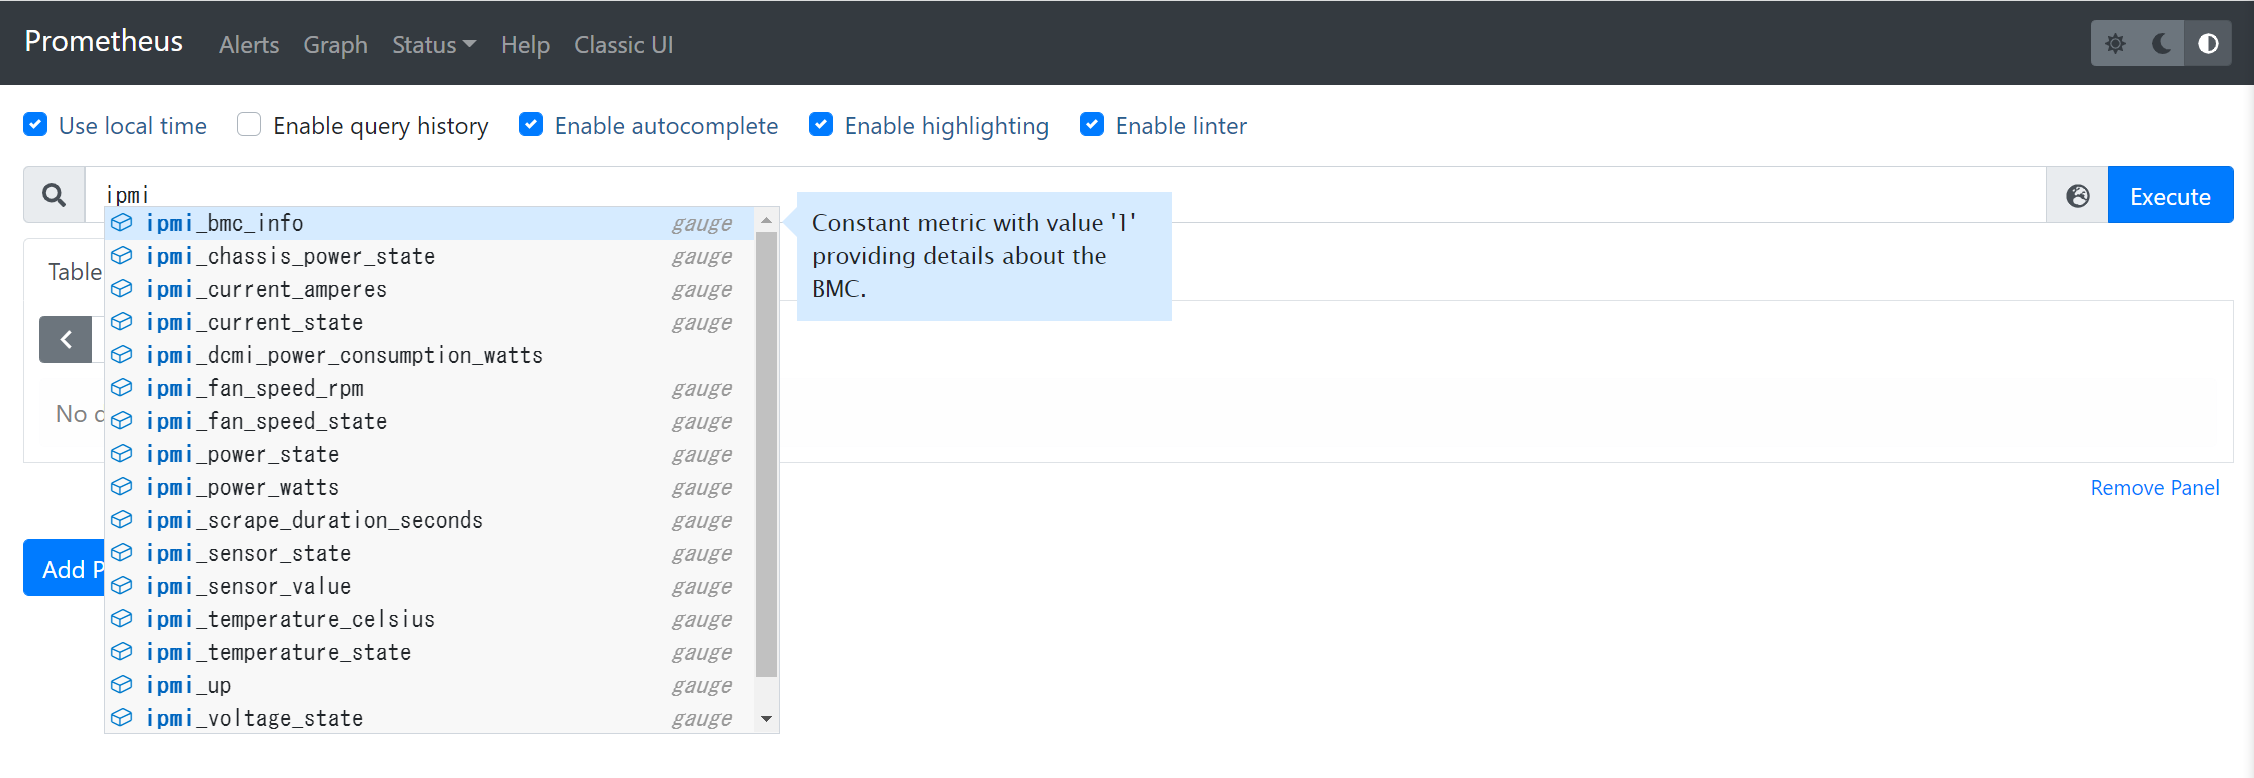
-
Graph タブで、ipmi 関連のメトリクスが候補に挙がり、値が取得できていることを確認する。
-
参考URL
[Prometheus公式ドキュメント] (https://prometheus.io/docs/introduction/overview/)
Prometheus関連のGitHubリポジトリ