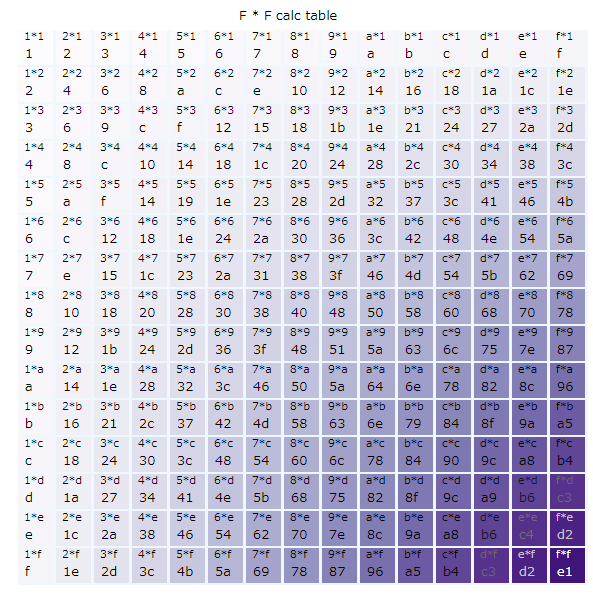
こんなの作った
8 かける 9 って 48 なんだって。知ってた? 80 行のHTML
要点
16進表現
> (8+4).toString(16)
'c'
連続値作成(aka range)
> [...Array(0xf).keys()]
[ 0, 1, 2, 3, 4, 5, 6, 7, 8, 9, 10, 11, 12, 13, 14 ]
文字列テンプレート
> num1 = 0x8
> num2 = 0x9
> `${(num1).toString(16)}*${(num2).toString(16)}`
'8*9'
> `${(num1 *num2).toString(16)}`
'48'
色を使うには D3 本体だけじゃだめ
<html> <head>
<script src="https://d3js.org/d3.v4.js"></script>
<script src="https://d3js.org/d3-color.v1.min.js"></script>
<script src="https://d3js.org/d3-interpolate.v1.min.js"></script>
<script src="https://d3js.org/d3-scale-chromatic.v1.min.js"></script>
</head>
部分適用
ロジックと環境を分けるとわかりやすい。
// 定義
const drawWith = (svg, scx, scy, scc, scc2) => (num1, num2) => {
  ....
// 利用
const draw = drawWith(svg, scX, scY, scC, scC2);
draw(0, 0);
draw(0xa, 0xb);
ソース
コピペして、Chorome あたりで開くとよい。80行のHTMLファイルなのでどんどん遊んでちょうだい。
<html> <head>
<script src="https://d3js.org/d3.v4.js"></script>
<script src="https://d3js.org/d3-color.v1.min.js"></script>
<script src="https://d3js.org/d3-interpolate.v1.min.js"></script>
<script src="https://d3js.org/d3-scale-chromatic.v1.min.js"></script>
</head>
<body>
  <div id="hoge"></div>
<script>

// constants
const canvas = [600, 600];
const margin = {top: 30, right: 15, bottom: 15, left: 15};
const width = canvas[0] - margin.left - margin.right;
const height = canvas[1] - margin.top - margin.bottom;

// functions
const createSVG = (selector) => (
  d3.select(selector).append("svg")
   .attr("width",  width + margin.left + margin.right)
   .attr("height", height + margin.top + margin.bottom)
   .append("g")
   .attr("transform", `translate(${margin.left}, ${margin.top})`)
);

const drawBackground = svg => {
  svg.append('g').append('rect')
    .attr('x', 0)
    .attr('y', 0)
    .attr('width', width)
    .attr('height', height)
    .style('fill', 'aliceblue')
}

const drawTitle = (svg, title) => {
  svg.append('g').append('text')
    .attr('transform', `translate(${width / 2 - 4 * title.length }, -10)`)
    .text(title)
    .style('font-size', '10pt')
}

const drawWith = (svg, scx, scy, scc, scc2) => (num1, num2) => {
  // box
  const boxsize = 35;
  svg.append('g').append('rect')
    .attr('x', scx(num1 - 1))
    .attr('y', scy(num2 - 1))
    .attr('width', boxsize)
    .attr('height', boxsize)
    .style('fill', scc(num1 * num2))
  // label
  svg.append('g').append('text')
    .attr('transform', `translate(${scx(num1 - 1) + 6}, ${scy(num2 - 1) + 10})`)
    .text(`${(num1).toString(16)}*${(num2).toString(16)}`)
    .style('font-size', '8pt')
    .style('fill', scc2(num1 * num2))
  // content
  svg.append('g').append('text')
    .attr('transform', `translate(${scx(num1 - 1) + 7}, ${scy(num2 - 1) + 28})`)
    .text((num1 * num2).toString(16))
    .style('font-size', '10pt')
    .style('fill', scc2(num1 * num2))
};

// main
const svg = createSVG("#hoge");
drawBackground(svg);
drawTitle(svg, 'F * F calc table');

const scX = d3.scaleBand().domain([...Array(0xf).keys()]).range([0, width]);
const scY = d3.scaleBand().domain([...Array(0xf).keys()]).range([0, height]);
const scC = d3.scaleSequential().interpolator(d3.interpolatePurples).domain([1, 0xf * 0xf]);
const scC2 = d3.scaleSequential().interpolator(d3.interpolateGreys).domain([0xf * 0xf, 180]);
const draw = drawWith(svg, scX, scY, scC, scC2);

for (let i = 0x1; i < 0x10; i++) {
  for (let j = 0x1; j < 0x10; j++) {
    draw(i, j)
  }
}

</script> </body>