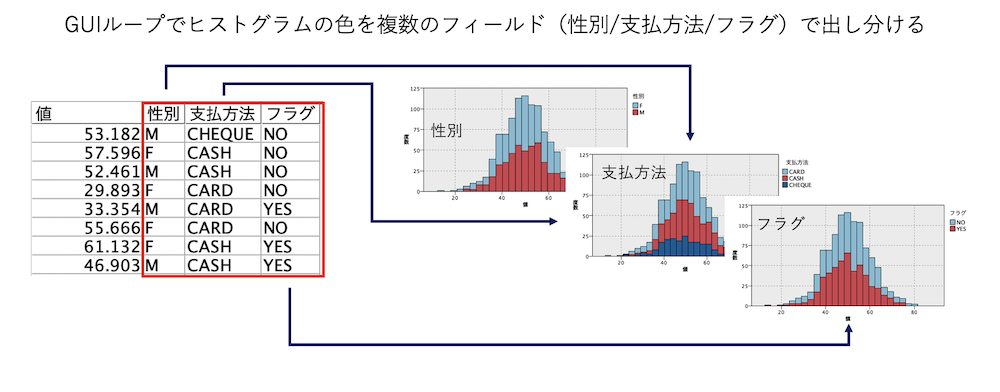
2
0

Delete article

Deleted articles cannot be recovered.

Draft of this article would be also deleted.

Are you sure you want to delete this article?

More than 1 year has passed since last update.

GUIループを使って列でグラフを出し分ける(SPSS Modeler データ加工逆引き9-11)

Last updated at Posted at 2023-03-21

グラフを列で出し分ける(GUIループ)

スクリーンショット 2023-03-17 18.01.23.png

1.想定される利用目的

・47都道府県別のグラフを作る際に、ストリームを何度も複製したり、スクリプトでループ処理したりすることなくGUI(マウス操作)で出し分ける

2.サンプルストリームのダウンロード

3.サンプルストリームの説明

スクリーンショット 2023-03-13 14.51.15.png

a.入力するデータは以下の通りです。

スクリーンショット 2023-03-13 14.53.35.png

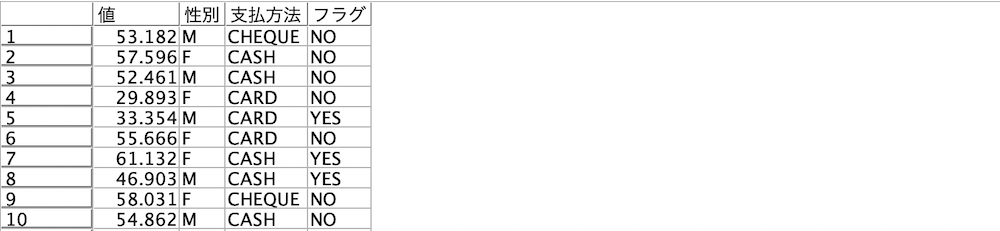
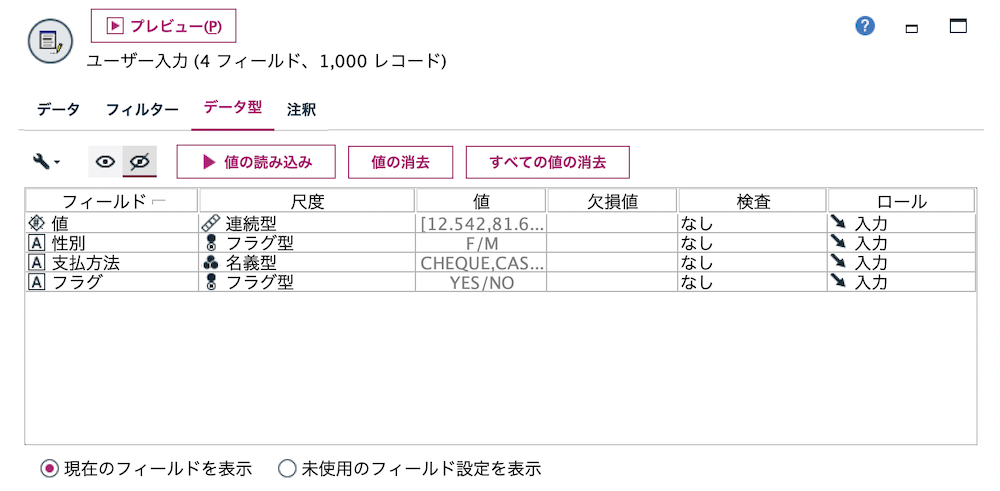
[データ型]タブの [値の読み込み]ボタンを押してデータの型を確定しておきます。
スクリーンショット 2023-03-13 14.54.06.png
 
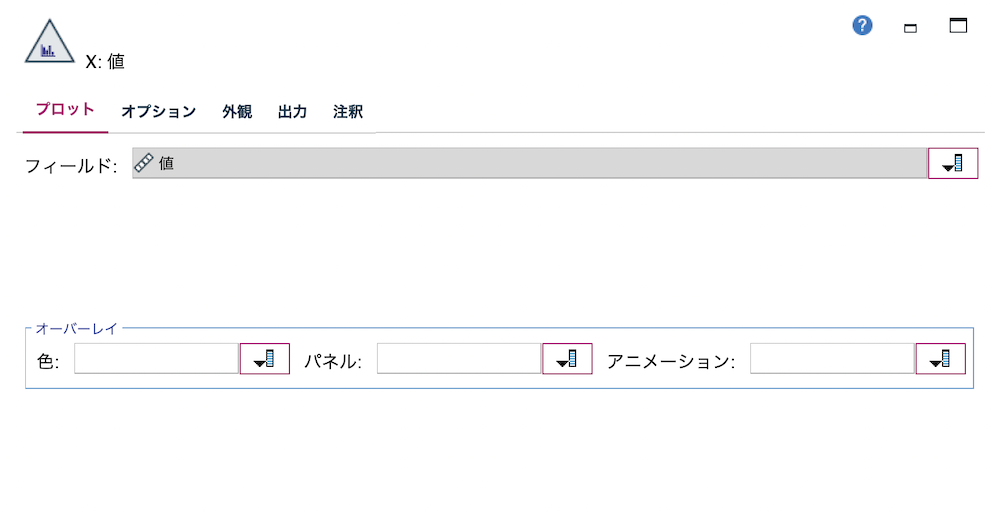
b.[ヒストグラム]ノードを編集します。[値]を対象にして確定します。
スクリーンショット 2023-03-13 14.54.42.png

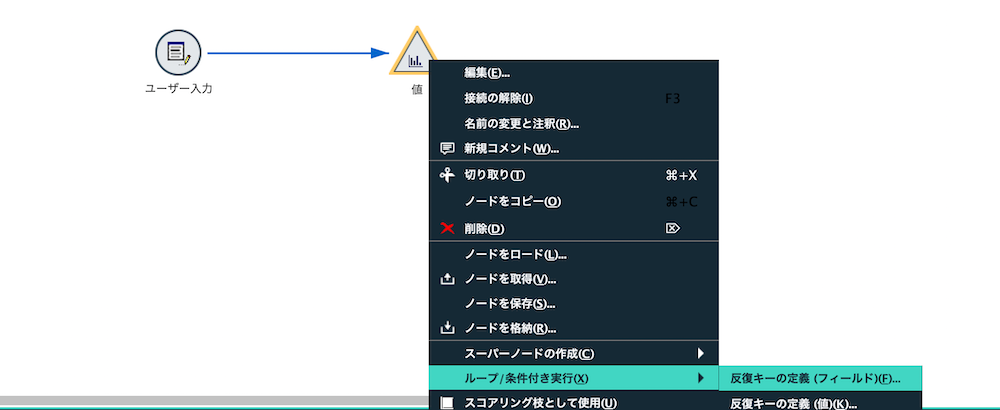
ノードを右クリックして[ループ/条件付き実行]>[反復キーの定義(フィールド)]を選択します。
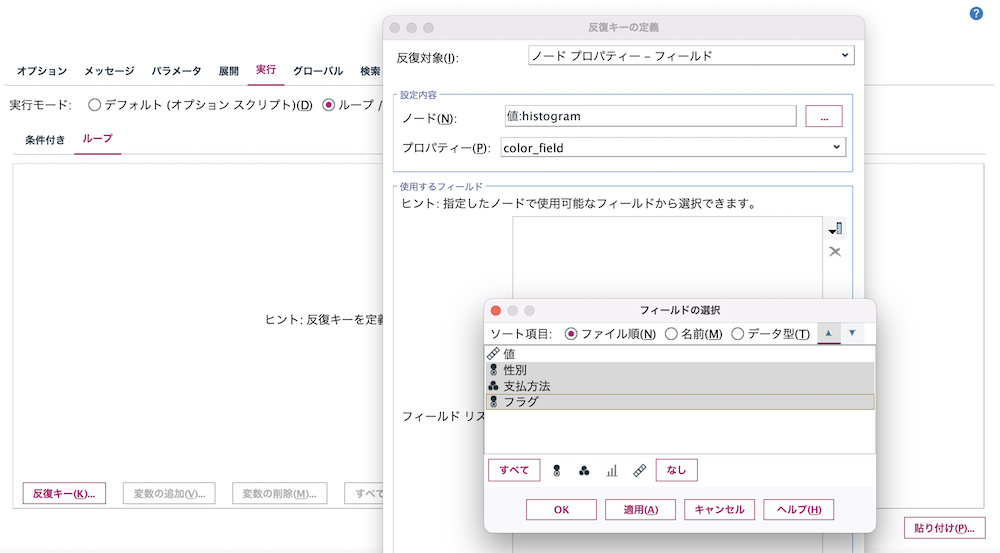
スクリーンショット 2023-03-13 14.55.17.png

以下の通りに設定します。
スクリーンショット 2023-03-13 14.57.22.png

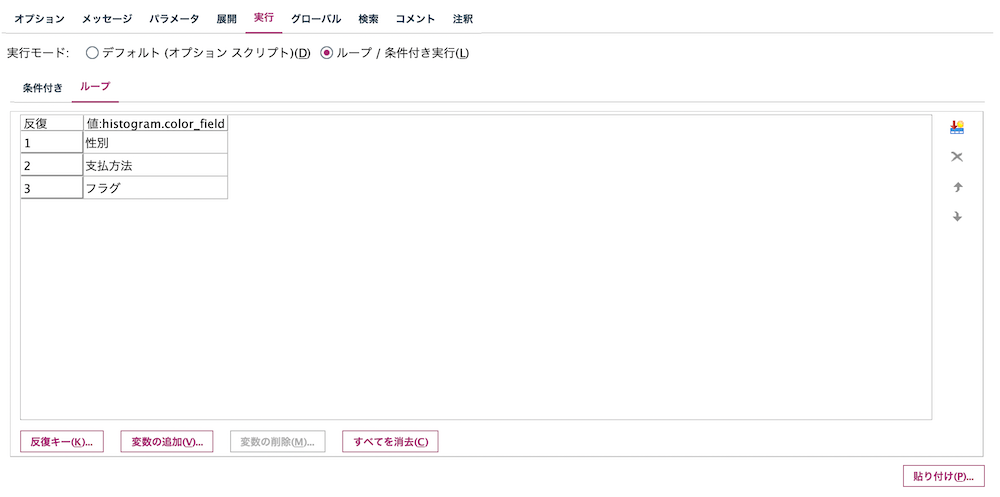
ストリームのプロパティ画面の [実行]タブが定義されました。ヒストグラムノードの[color_filed]に3つのフィールドがループされる設定です。
スクリーンショット 2023-03-13 14.57.58.png

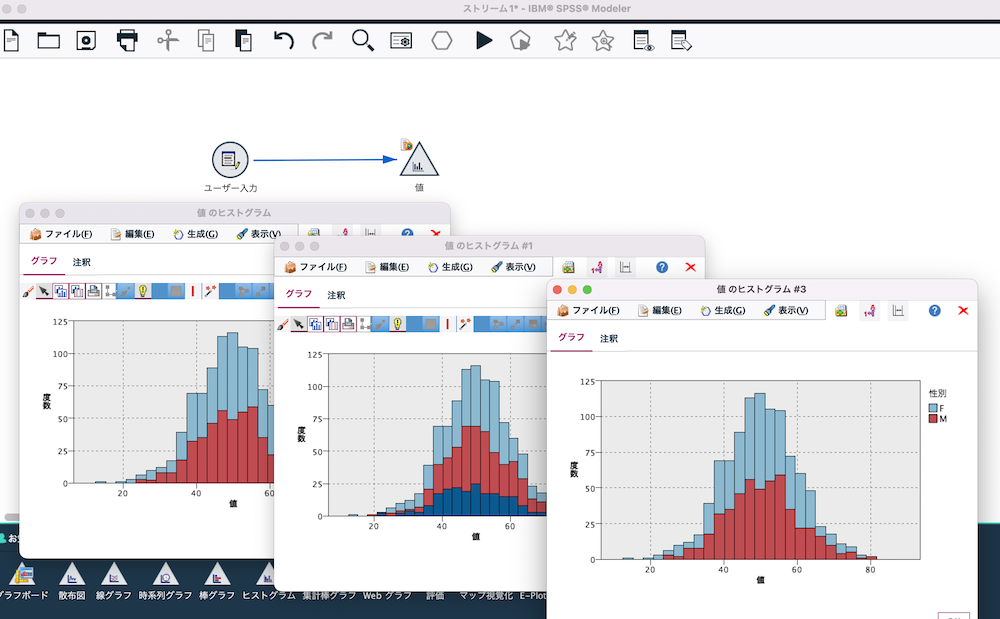
画面上の再生ボタン▶︎を押すと3つの種類のグラフがループ実行されます。
スクリーンショット 2023-03-13 15.00.36.png

注意事項

250種類以上のカテゴリを同時に扱う場合には以下を参考にしてください。

4.参考情報

GUIループについて解説した記事

SPSS Modeler ノードリファレンス目次

SPSS Modeler 逆引きストリーム集(データ加工)

2
0
0

Register as a new user and use Qiita more conveniently

  1. You get articles that match your needs
  2. You can efficiently read back useful information
  3. You can use dark theme
What you can do with signing up
2
0

Delete article

Deleted articles cannot be recovered.

Draft of this article would be also deleted.

Are you sure you want to delete this article?