今回の目的
gatsbyで作成したサイトのデバッグをVSCodeで実行できるように、VSCodeを設定していきます。
まずはVSCodeを開く!
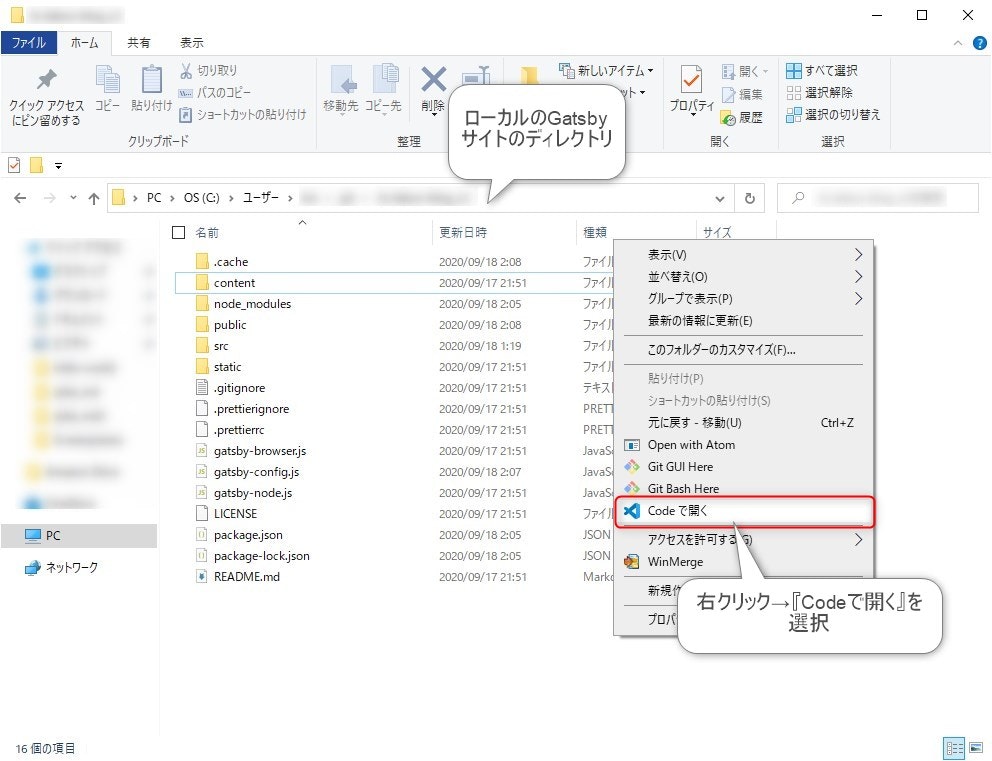
gatsbyのサイトを作成しているディレクトリにてVSCOdeを開きます。
Debugger for Chromeのインストール
VSCodeの拡張機能アイコンをクリックます。
『Debugger for Chrome』と入力し、対象機能をインストールします。
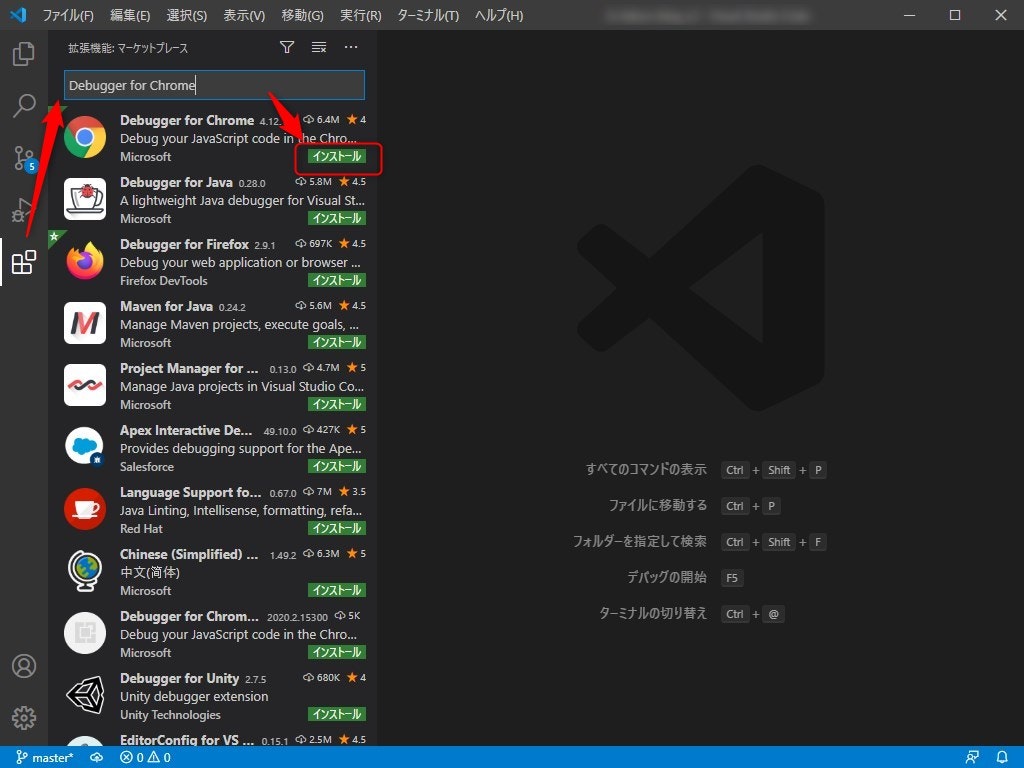
※インストール完了後にVSCodeの再起動が必要かもしれません。
launch.jsonの作成
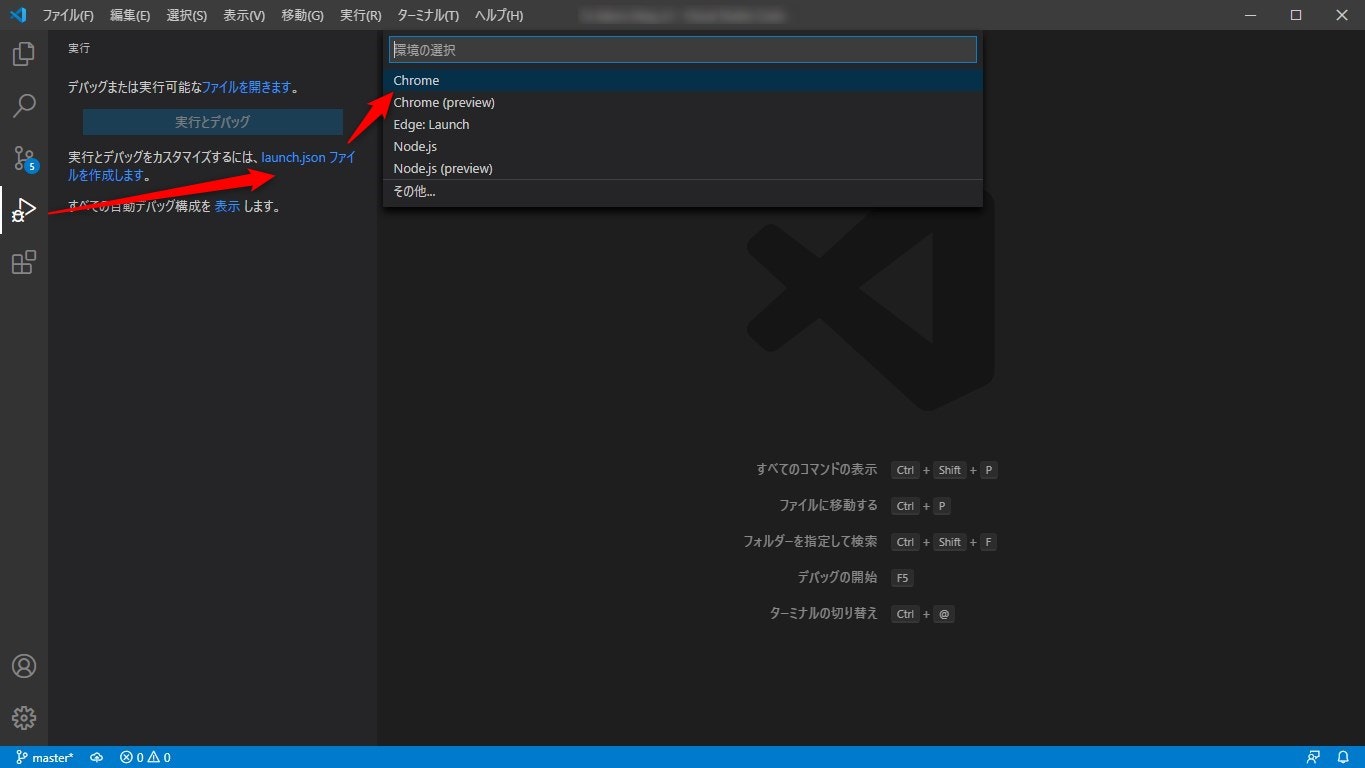
実行アイコンクリック→『launch.jsonファイルを作成します』リンククリックを行うと、環境の選択が出てきます。
後ほど書き換えるのでどれを選択しても問題ないです。
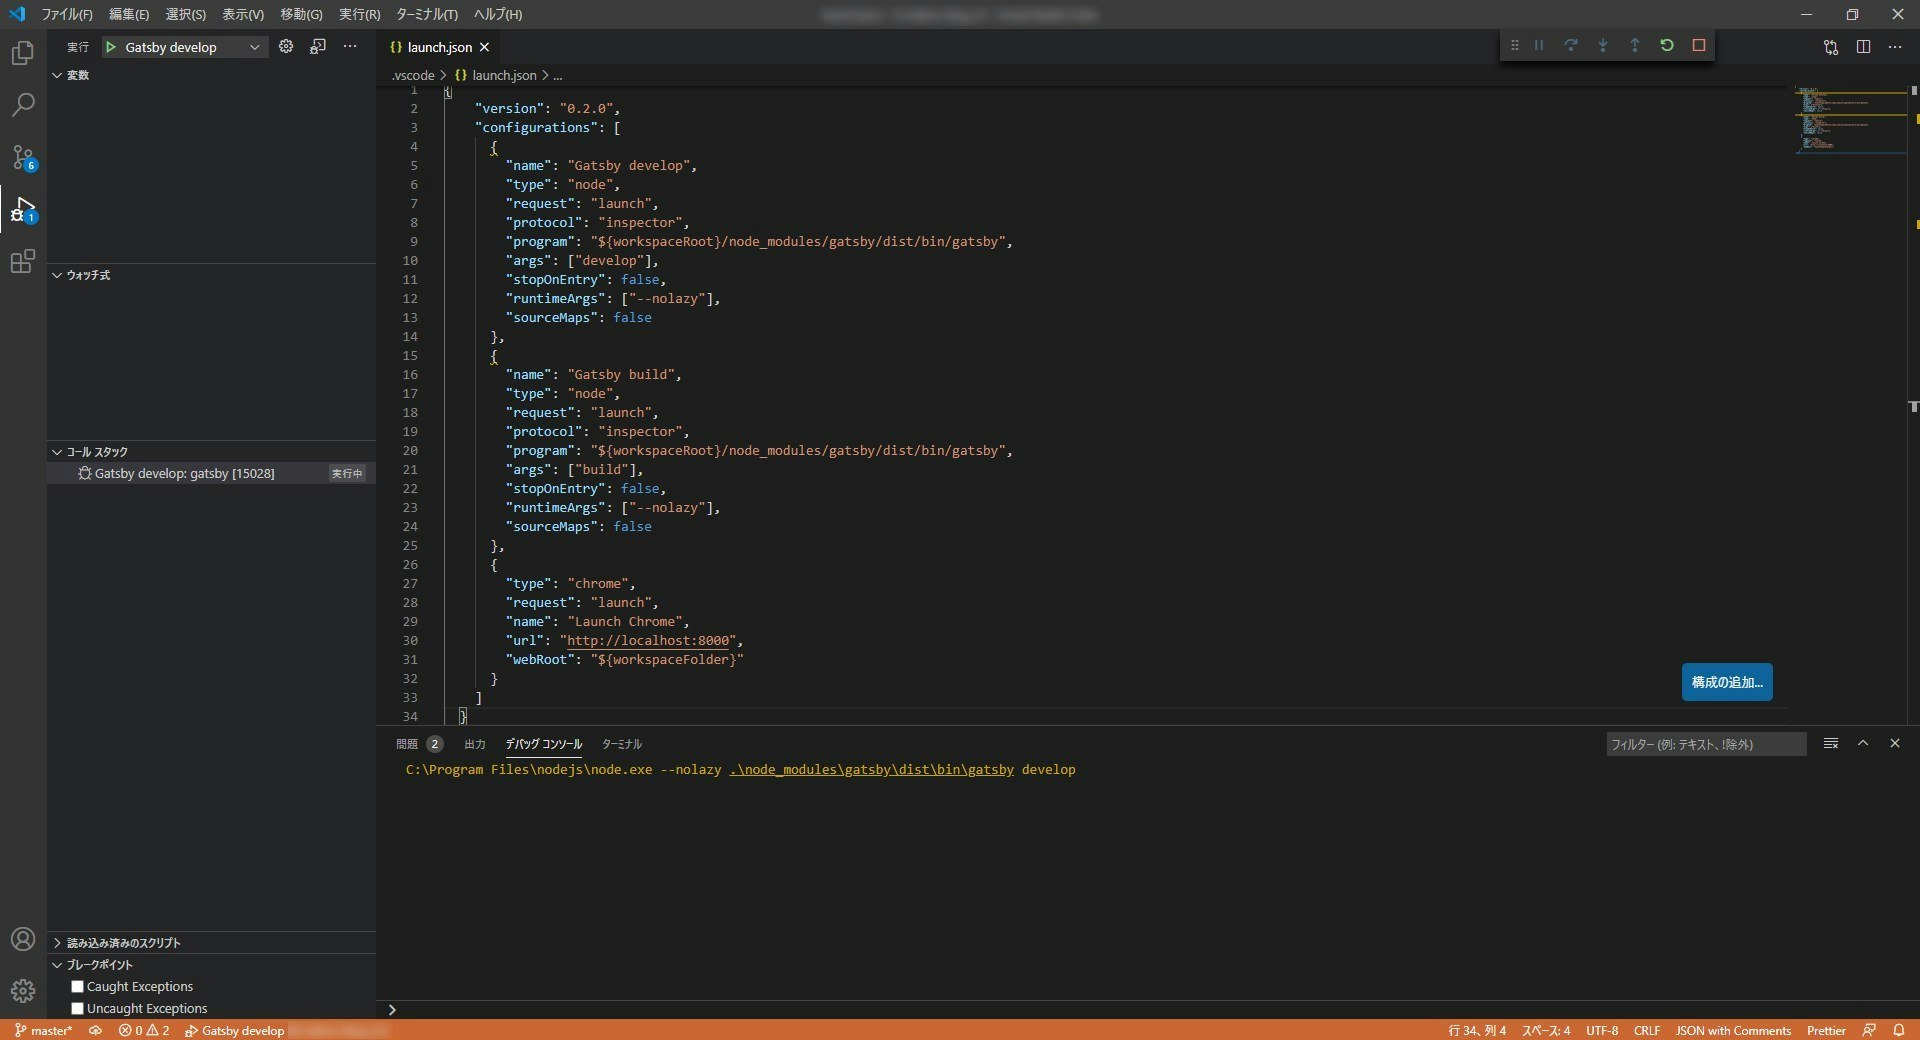
作成されたlaunch.jsonを以下に書き換えます。
.vscode/launch.json
{
  "version": "0.2.0",
  "configurations": [
    {
      "name": "Gatsby develop",
      "type": "node",
      "request": "launch",
      "protocol": "inspector",
      "program": "${workspaceRoot}/node_modules/gatsby/dist/bin/gatsby",
      "args": ["develop"],
      "stopOnEntry": false,
      "runtimeArgs": ["--nolazy"],
      "sourceMaps": false
    },
    {
      "name": "Gatsby build",
      "type": "node",
      "request": "launch",
      "protocol": "inspector",
      "program": "${workspaceRoot}/node_modules/gatsby/dist/bin/gatsby",
      "args": ["build"],
      "stopOnEntry": false,
      "runtimeArgs": ["--nolazy"],
      "sourceMaps": false
    },
    {
      "name": "Launch Chrome",
      "type": "chrome",
      "request": "launch",
      "url": "http://localhost:8000",
      "webRoot": "${workspaceFolder}"
    }
  ]
}
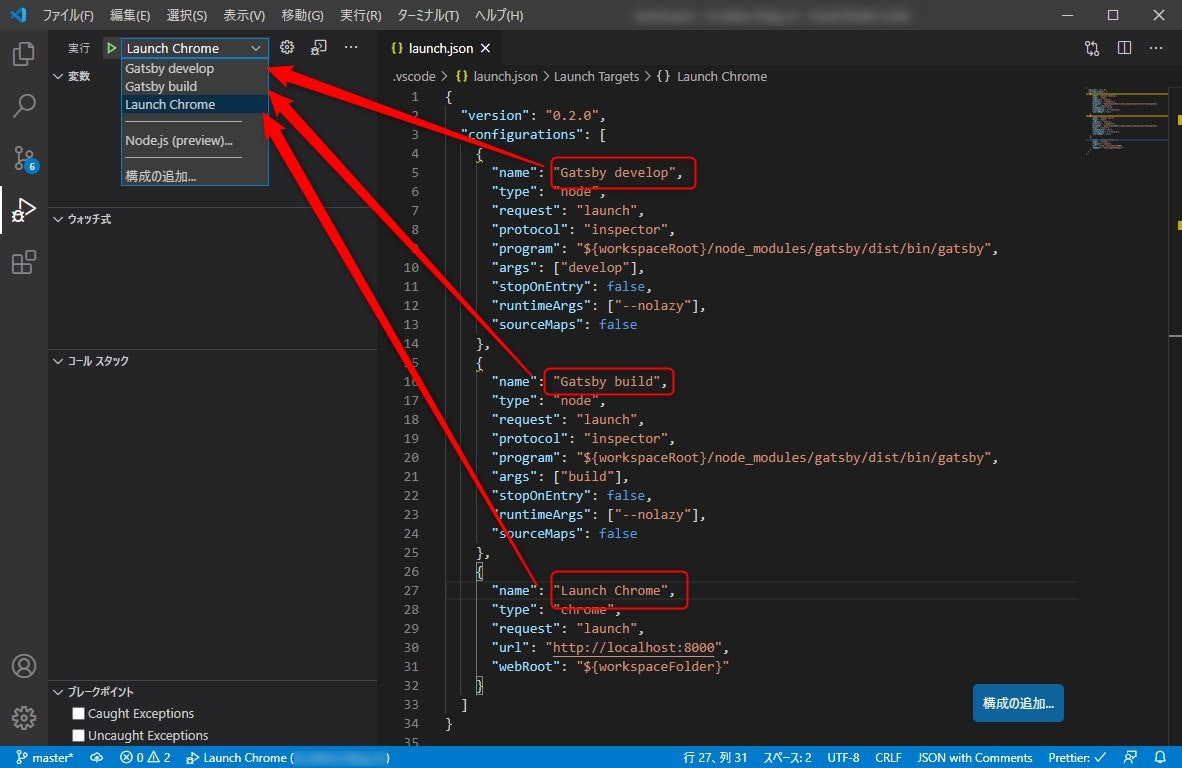
実行構成が追加されています。
- Gatsby develop
gatsby developをデバッグ実行します。デプロイ処理などのデバッグを行います。 - Gatsby build
gatsby buildをデバッグ実行します。 - Launch Chrome
実行時にChromeを起動しhttp://localhost:8000にアクセスします。
モジュールの表示処理時などのデバッグを行います。
起動
Gatsby developを選択し、再生ボタン(緑三角ボタン)を押します。
develop処理のデバッグが開始されます。
Launch Chromeを選択し、再生ボタンを押下するとchromeが自動で開き対象のサイトが確認できます。
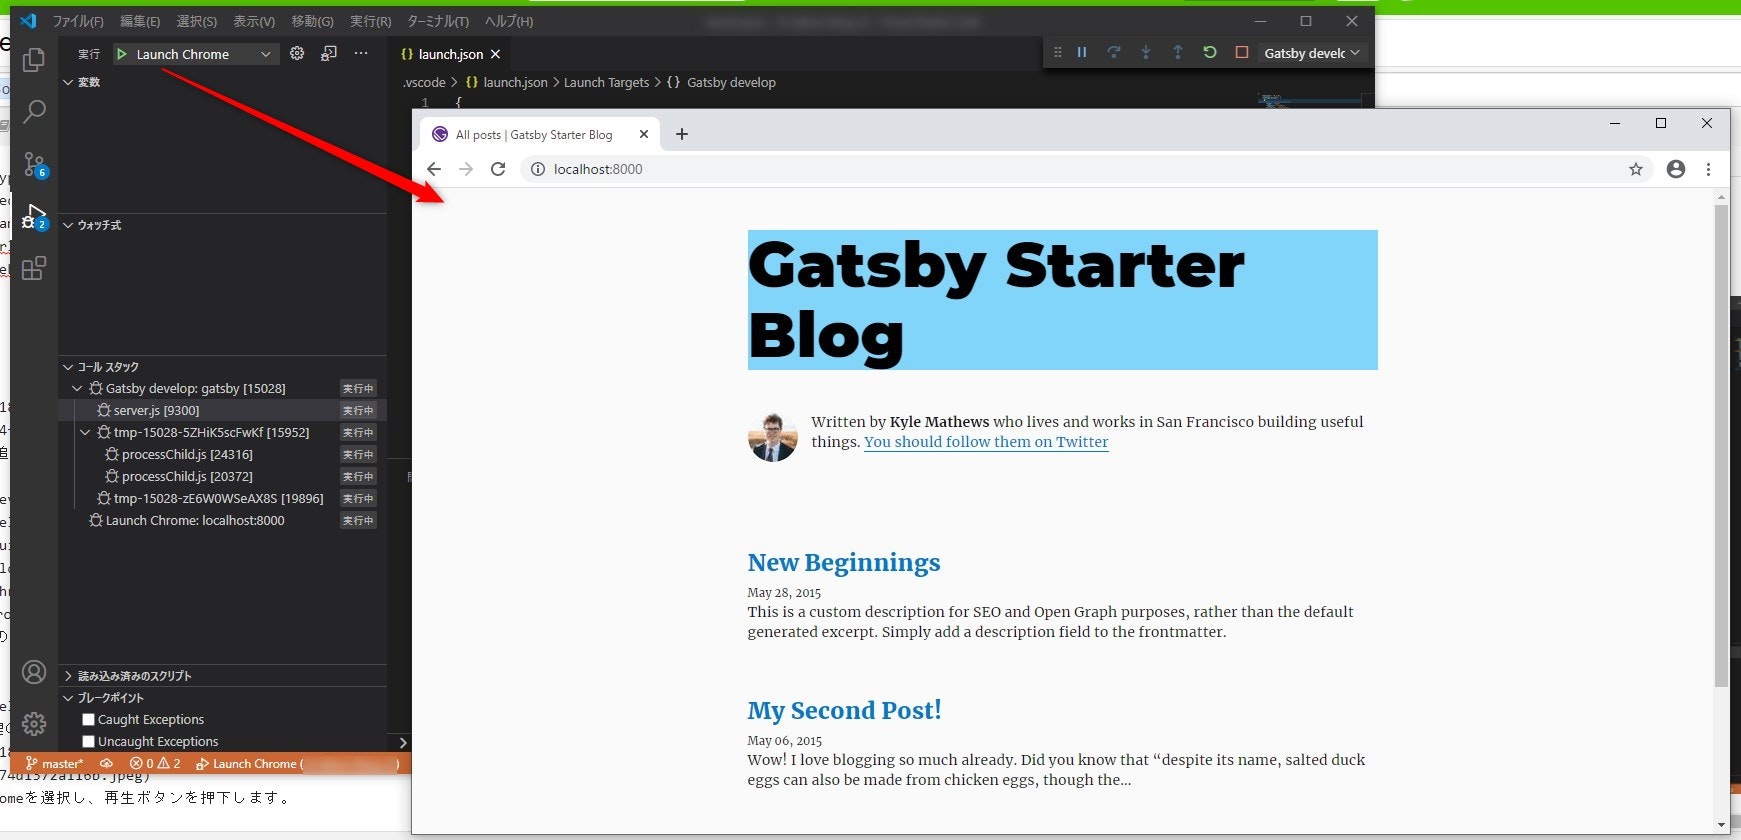
これでgatsbyサイトのデバッグが可能になりました。
あとは適当な箇所にブレークポイントを入れ、好きなようにデバッグしちゃってください。
今回は以上です。
ありがとうございました。
参考サイト
How to debug Gatsby.js in VS Code (build process and client side)