この記事の前の話はこちら
この記事の続きはこちら
単振り子
力学シミュレーションの初歩中の初歩、単振り子をやってみた。
一様重力場の中で、1個の質点が鉛直面内である点を中心とする円軌道上に束縛されながら
自由に運動する系を、単振り子という。
(「単振り子」という語に厳密な定義があるのか、これなのか、
実を言うと知らない。これは、なんとなくの説明だな。)
単振り子の運動は単振動ではなく、「振り子の等時性」が成り立たない。
微小振動の場合、1次近似では単振動となり、「振り子の等時性」が(近似的に)成り立つ。
そこらへんを再現できるか、試してみようというわけだ。
理屈
運動方程式
円軌道のある鉛直面内に、円軌道の中心を原点として鉛直上向きの$z$軸と水平方向の$x$軸をとる。
円軌道の半径を $L$ とする。
質点と原点を結ぶ線分が、原点から真下に伸びる半直線に対してなす角を $\theta$ とする。
質点には、その位置・速度によらず、一定の方向(鉛直下向き)に一定の 大きさ $m \hspace{0.1em} g$ ( $m$ : 質点の質量、 $g$ : 重力加速度の大きさ)の重力がはたらく。
この重力場の中で質点が円軌道上を自由に運動するとき、質点が受ける力は、重力と運動を円軌道上に束縛するための束縛力(糸で吊るした単振り子であれば、糸の張力)の2つで、
その合力が
- 軌道接線方向成分 : 大きさ $m \hspace{0.1em} g \hspace{0.1em} \sin \theta$ で最下点に向かう向き
- 軌道半径方向成分 : 大きさ $\displaystyle \frac{m \hspace{0.1em} v^{2}}{L}$ ( $v$ : 質点の速さ)で原点に向かう向き
となる。すなわち
- $x$方向成分 : $\displaystyle - m \hspace{0.1em} g \hspace{0.1em} \sin \theta \cdot \cos \theta - \frac{m \hspace{0.1em} v^{2}}{L} \hspace{0.1em} \sin \theta$
- $z$方向成分 : $\displaystyle - m \hspace{0.1em} g \hspace{0.1em} \sin \theta \cdot \sin \theta + \frac{m \hspace{0.1em} v^{2}}{L} \hspace{0.1em} \cos \theta$
である。
プログラム
運動方程式の関数 f
f <- function(f.t,f.rv) {

f.theta <- atan( - f.rv$x / f.rv$z )
f.theta[ which( f.rv$z == 0 ) ] <- pi / 2.0

f.at <- - g * sin( f.theta )
f.ar <- ( f.rv$vx^2 + f.rv$vy^2 + f.rv$vz^2 ) / L
f.ax <- f.at * cos( f.theta ) - f.ar * sin( f.theta )
f.az <- f.at * sin( f.theta ) + f.ar * cos( f.theta )

return( data.frame( x=f.rv$vx , y=f.rv$vy , z=f.rv$vz , vx=f.ax , vy=0.0 , vz=f.az ) )

}
境界条件の関数 boundary.condition
境界条件は、とくにない。
運動が円軌道上に束縛されているという束縛条件は、運動方程式を定式化するときに考慮したので、運動方程式にすでに含まれている。
boundary.condition <- function(boundary.condition.t,boundary.condition.rv) {

return( boundary.condition.rv )

}
パラメータ
n <- 1
g <- 9.8
L <- 1.0
m <- c( 1.0 )

t0 <- 0.0
theta0 <- 60.0 / 180.0 * pi
omega0 <- 0.0

x0 <- L * sin( theta0 )
y0 <- 0.0
z0 <- - L * cos( theta0 )
vx0 <- L * omega0 * cos( theta0 )
vy0 <- 0.0
vz0 <- L * omega0 * sin( theta0 )

tend <- 10.0

Deltat <- 2.0e-4
draw.step <- 100
xmin <- - L
xmax <- L
ymin <- - L
ymax <- L
n : 質点数 今回は 1
g : 重力加速度の大きさ $g$
L : 円軌道の半径 $L$
m : 質点の質量 $m$
t0 : 初期状態の時刻
theta0 : 初期状態での $\theta$
omega0 : 初期状態での $\dot{\theta}$ (角速度)
x0 y0 z0 : 初期状態での質点の座標
vx0 vy0 vz0 : 初期状態での質点の速度の各成分
tend : 終状態の時刻
結果を出力するコード
グラフィックと数値の両方を出力してみた。
さらに、計算の精度を検証する目的で、力学的エネルギーを計算し、数値として共に出力した。
以下、項目に分けて説明。
関数 output
output <- function() {

plot(rv$x,rv$z,xlim=c(xmin,xmax),ylim=c(ymin,ymax),xlab="x",ylab="z",tcl=0.5,las=1,mgp=c(2.5,0.3,0),text(0.5,0.8,labels=paste("t =",as.character(round(t,digits=3)))))

output.e <- m / 2.0 * ( rv$vx^2 + rv$vy^2 + rv$vz^2 ) + m * g * rv$z
return( rbind( results , c( t , rv$x , rv$z , output.e ) ) )

}
results という変数(マトリックス)を書き換える処理をしている。
値を書き換える場合には、グローバル変数である results を 関数 output の中で直接操作しても効果がない(変数のスコープの問題)ので、 output の戻り値として返し results に再代入するという操作にした。
したがってメインルーチンにも小さな修正。
メインルーチンを一部修正
前回記事では単に output() だけだった部分を
results <- output()
に修正。
メインルーチンの前の処理
### preparation to output

png(filename="%04d.png",width=960,height=960,units="px",res=192)

results <- matrix( c( 0 , 0 , 0 , 0 ) , nrow=1 , ncol=4 )
colnames(results) <- c( "t" , "x" , "z" , "E" )

###
results は数値の出力に使うマトリックス。
すべてのデータを一旦このマトリックスに格納して、計算終了後に出力する。
実は、計算しながら逐次出力していくための R の命令をまだ覚えていなかったりする。
メインルーチンの後の処理
### post-processing to output

graphics.off()

write.table(as.data.frame(results[-1,]),file="results",sep=" ",row.names=FALSE,col.names=TRUE)

###
ここで一気に results の内容を出力。
全リスト
################################################################
## parameters
## modify this section to change condition
################################################################

n <- 1
g <- 9.8
L <- 1.0
m <- c( 1.0 )

t0 <- 0.0
theta0 <- 60.0 / 180.0 * pi
omega0 <- 0.0

x0 <- L * sin( theta0 )
y0 <- 0.0
z0 <- - L * cos( theta0 )
vx0 <- L * omega0 * cos( theta0 )
vy0 <- 0.0
vz0 <- L * omega0 * sin( theta0 )

tend <- 10.0

Deltat <- 2.0e-4
draw.step <- 100
xmin <- - L
xmax <- L
ymin <- - L
ymax <- L


################################################################
## output
## modify this section to change the method to output
################################################################

output <- function() {

plot(rv$x,rv$z,xlim=c(xmin,xmax),ylim=c(ymin,ymax),xlab="x",ylab="z",tcl=0.5,las=1,mgp=c(2.5,0.3,0),text(0.5,0.8,labels=paste("t =",as.character(round(t,digits=3)))))

output.e <- m / 2.0 * ( rv$vx^2 + rv$vy^2 + rv$vz^2 ) + m * g * rv$z
return( rbind( results , c( t , rv$x , rv$z , output.e ) ) )

}


################################################################
## models
## modify this section to change physical model
################################################################

f <- function(f.t,f.rv) {

f.theta <- atan( - f.rv$x / f.rv$z )
f.theta[ which( f.rv$z == 0 ) ] <- pi / 2.0

f.at <- - g * sin( f.theta )
f.ar <- ( f.rv$vx^2 + f.rv$vy^2 + f.rv$vz^2 ) / L
f.ax <- f.at * cos( f.theta ) - f.ar * sin( f.theta )
f.az <- f.at * sin( f.theta ) + f.ar * cos( f.theta )

return( data.frame( x=f.rv$vx , y=f.rv$vy , z=f.rv$vz , vx=f.ax , vy=0.0 , vz=f.az ) )

}


boundary.condition <- function(boundary.condition.t,boundary.condition.rv) {

return( boundary.condition.rv )

}


################################################################
## engines
## do not modify this section
################################################################

runge.kutta.4th <- function(runge.kutta.4th.t,runge.kutta.4th.rv) {

runge.kutta.4th.k0 <- f( runge.kutta.4th.t , runge.kutta.4th.rv ) * Deltat
runge.kutta.4th.k1 <- f( runge.kutta.4th.t + Deltat / 2.0 , runge.kutta.4th.rv + runge.kutta.4th.k0 / 2.0 ) * Deltat
runge.kutta.4th.k2 <- f( runge.kutta.4th.t + Deltat / 2.0 , runge.kutta.4th.rv + runge.kutta.4th.k1 / 2.0 ) * Deltat
runge.kutta.4th.k3 <- f( runge.kutta.4th.t + Deltat , runge.kutta.4th.rv + runge.kutta.4th.k2 ) * Deltat

runge.kutta.4th.Deltarv <- ( runge.kutta.4th.k0 + 2.0 * ( runge.kutta.4th.k1 + runge.kutta.4th.k2 ) + runge.kutta.4th.k3 ) / 6.0

return( runge.kutta.4th.rv + runge.kutta.4th.Deltarv )

}


### preparation to output

png(filename="%04d.png",width=960,height=960,units="px",res=192)

results <- matrix( c( 0 , 0 , 0 , 0 ) , nrow=1 , ncol=4 )
colnames(results) <- c( "t" , "x" , "z" , "E" )

###

t <- t0
rv <- data.frame( x=x0 , y=y0 , z=z0 , vx=vx0 , vy=vy0 , vz=vz0 )

while(t<=tend) {

results <- output()

for(i in 1:draw.step) {

rv <- runge.kutta.4th(t,rv)

rv <- boundary.condition(t,rv)

t <- t + Deltat

}

}


### post-processing to output

graphics.off()

write.table(as.data.frame(results[-1,]),file="results",sep=" ",row.names=FALSE,col.names=TRUE)

###
実行結果
$\theta_{0} = 60^{\circ}$ の場合
$\theta_{0} = 30^{\circ}$ の場合
$\theta_{0} = 5^{\circ}$ の場合
数値出力をチェック
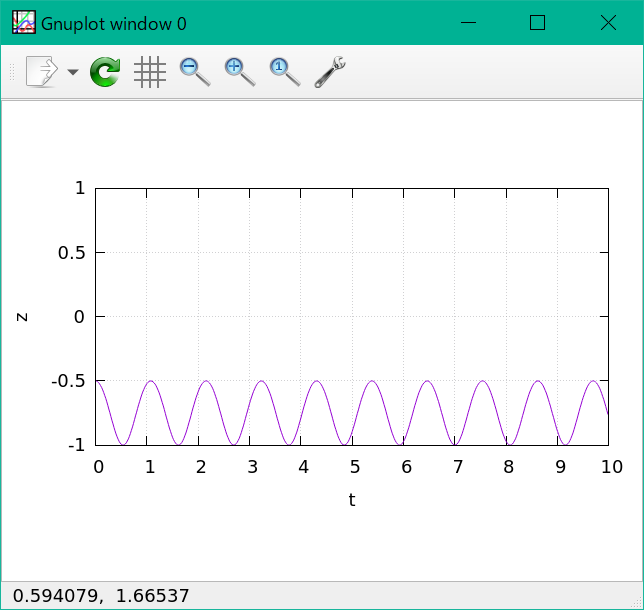
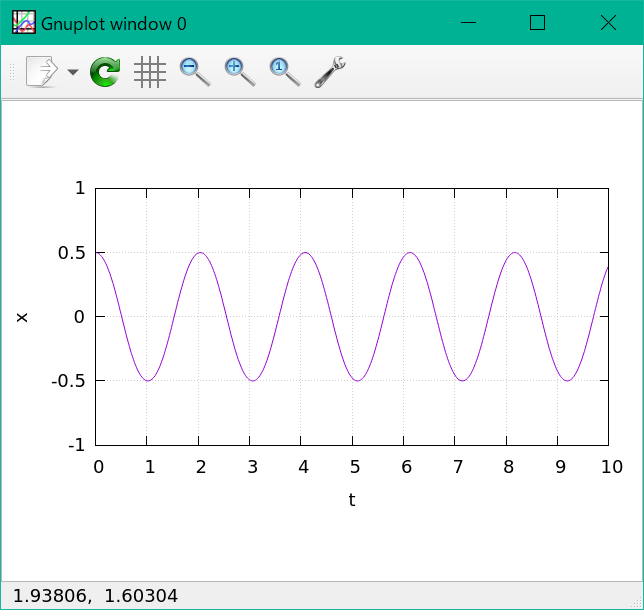
$\theta_{0} = 60^{\circ}$ の結果を、 gnuplot を使って $x$-$t$ グラフと $z$-$t$ グラフに描いてみると


綺麗に振動している。
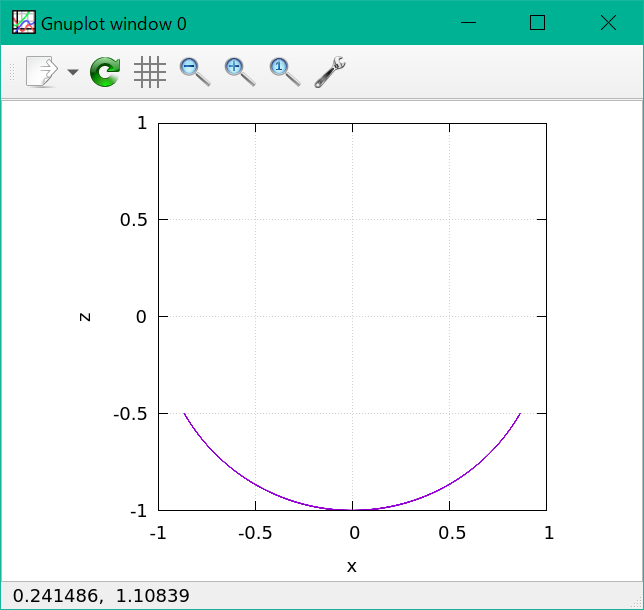
$z$-$x$ グラフにしてみると

正確に円軌道を描いている。
$\theta_{0} = 30^{\circ}$ の場合の結果は、以下の通り。
$\theta_{0} = 5^{\circ}$ の場合の結果は、以下の通り。
力学的エネルギーの保存
このような時間発展のシミュレーションの正確さを調べる手段の1つに、保存量の時間変化を見るというのがある。
単振り子の場合なら力学的エネルギーが保存するので、それを出力してみて、時間変化せず一定になっていたら、シミュレーションは正確である可能性がある、ということだ。
試してみた。
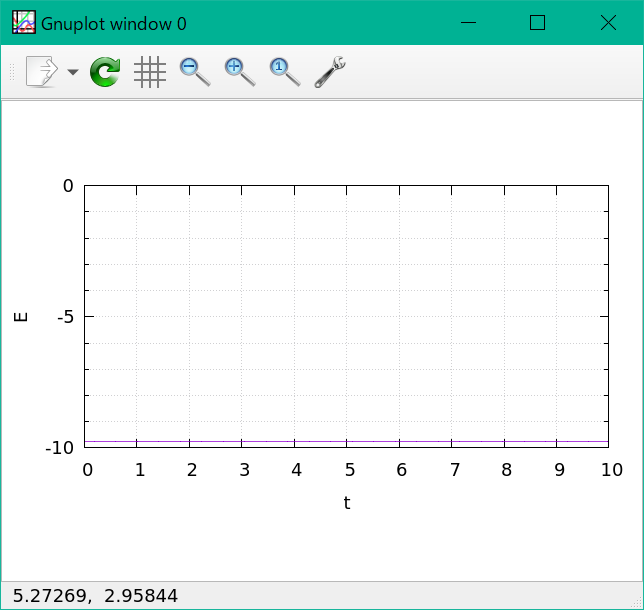
縦軸に 力学的エネルギー $E$ 、横軸に 時刻 $t$ をとってグラフに描いた。
$\theta_{0} = 60^{\circ}$ の場合では

となった。力学的エネルギーは保存しているようである。
$\theta_{0} = 30^{\circ}$ の場合では

$\theta_{0} = 5^{\circ}$ の場合では

どれもちゃんと $E$ が保存している。
この計算結果は信用できる可能性が高くなった。
等時性の確認
上に示したグラフからもわかるが、はっきり比較するために上の3つの $x$-$t$グラフ を重ねてみると

となる。
3つの場合の周期は一致していない。振幅が大きいほど周期が長くなっている。
単振り子において、等時性は成り立たないことが確かめられた!


