平成最後に滑り込み投稿。
突発的に書きたくなったので、色々荒くてすみません。
概要
Twitterが公開しているAPIの中に、「status/filter」というものがあり、これを使えば、指定された範囲のTweetをリアルタイムで取得することができます。
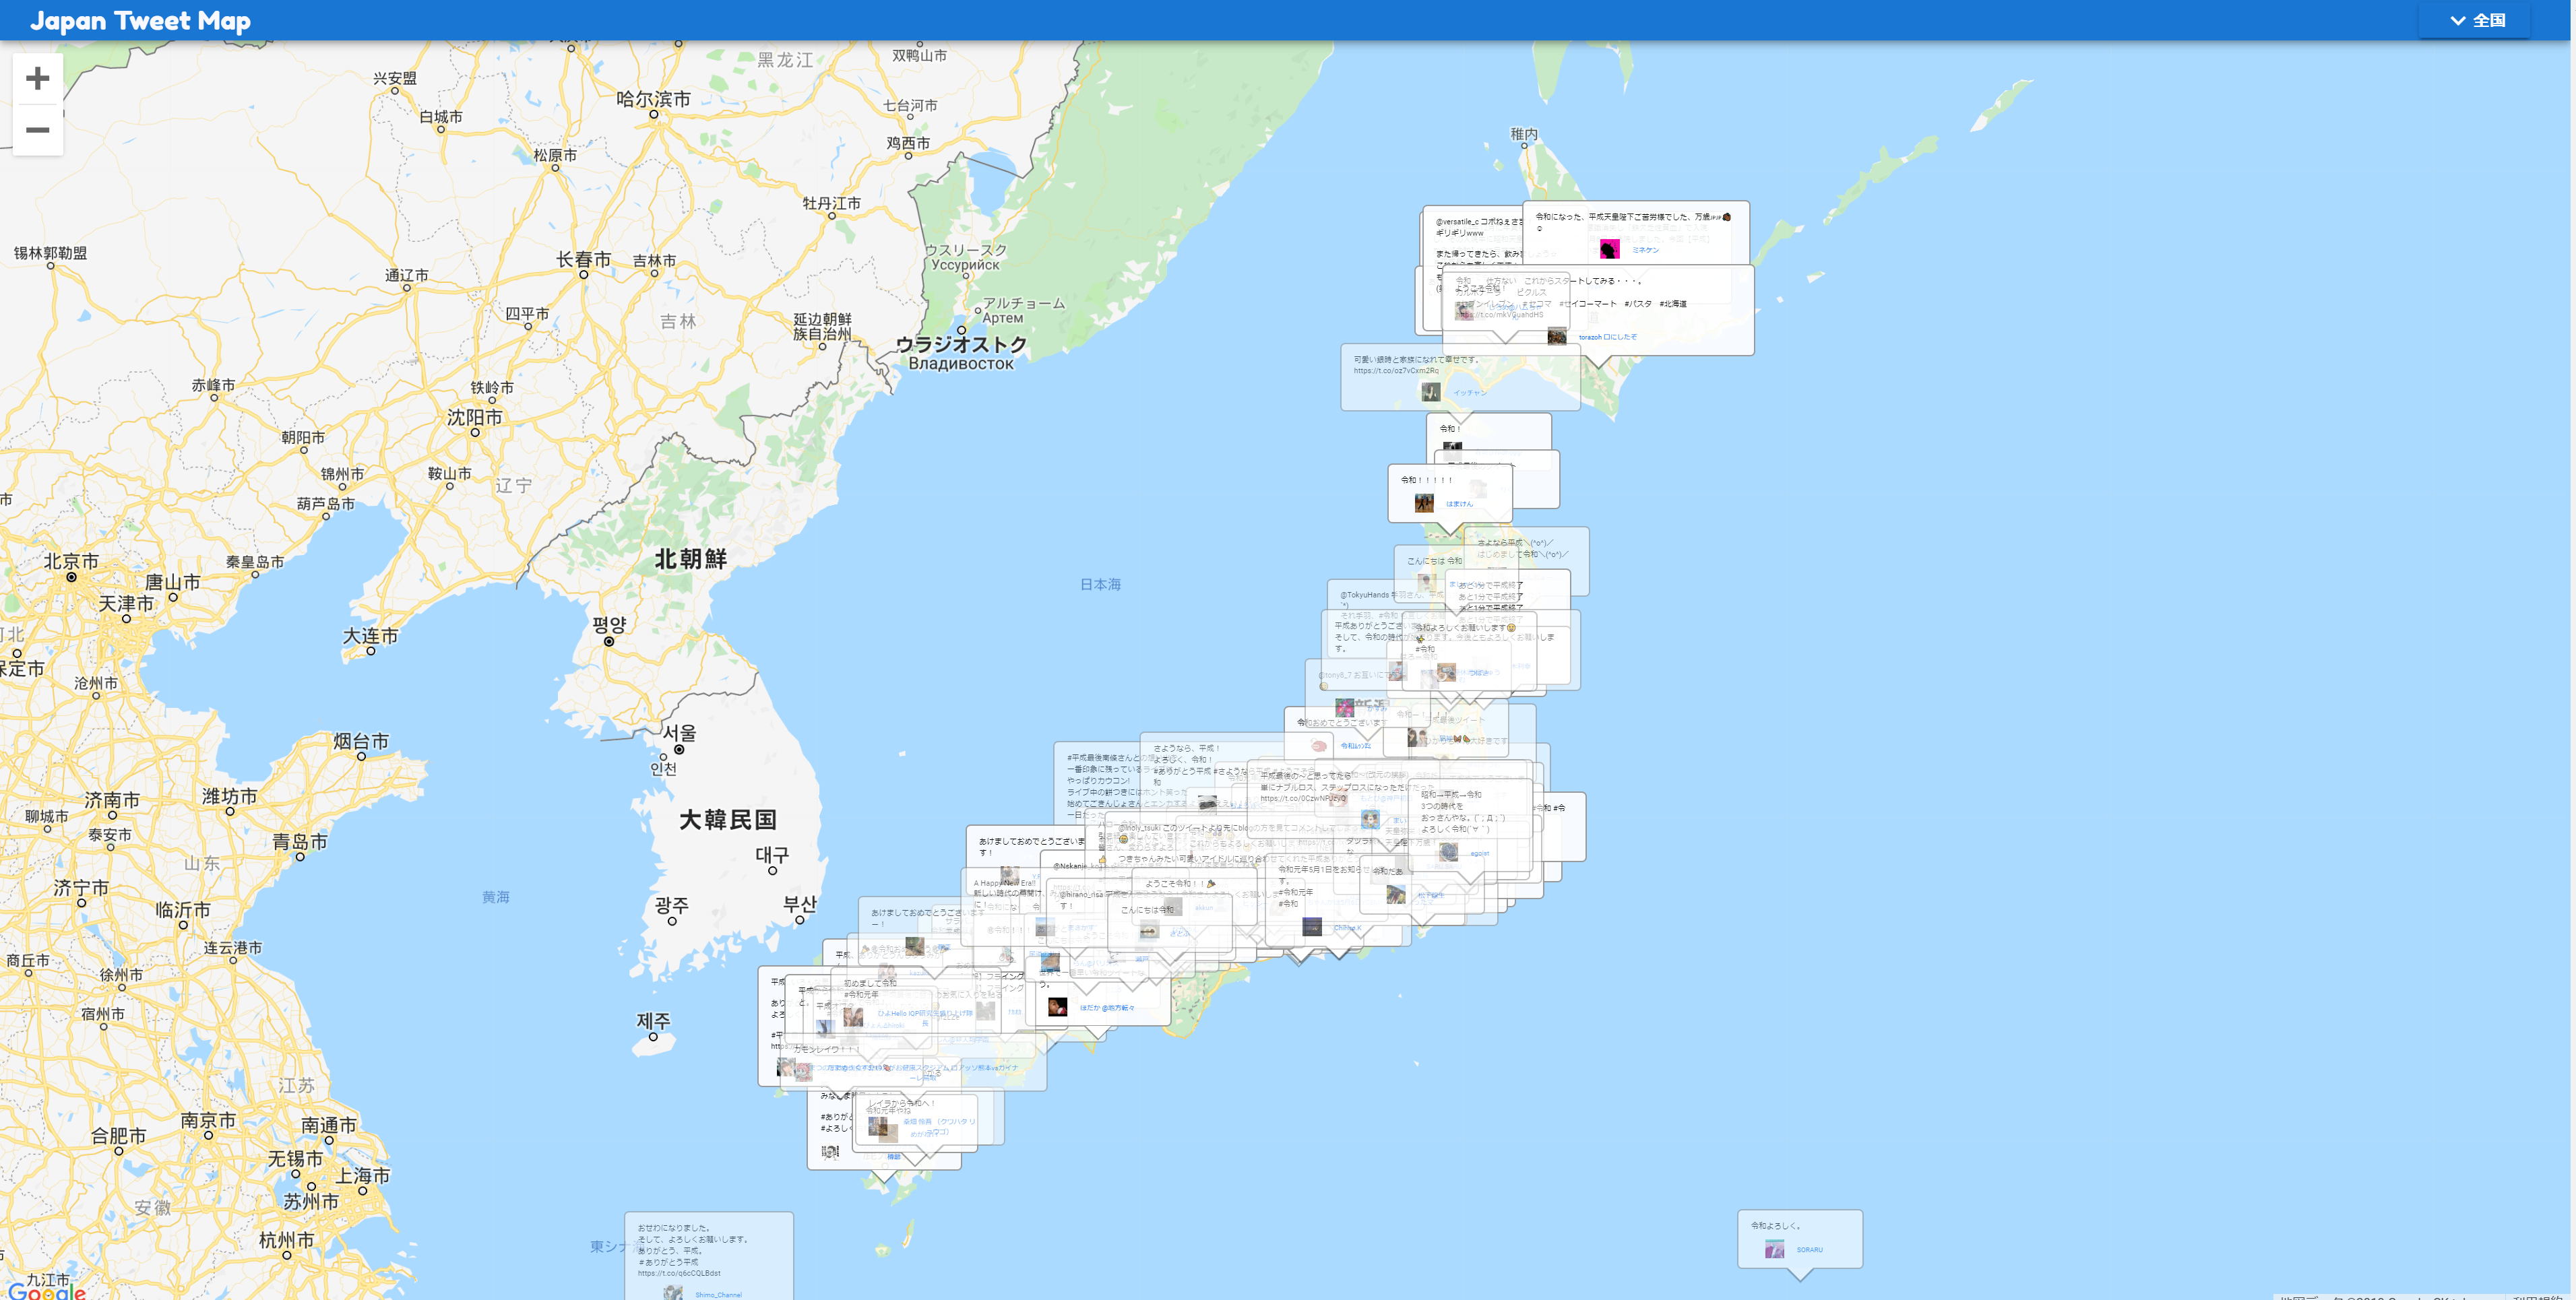
そのAPIを使い、日本国内で呟かれたTweetを収集し、↑のようにGoogle Map上に(ほぼ)リアルタイムで表示してみました。
令和を迎えるときに、日本各地ではどのようなつぶやきがされているのか、眺めてみるのはどうでしょう。
こちらが作成したページです。
http://japan-tweet-map.net/
処理の概要
バッチ側
Twitter API の 「status/filter」 を使用し、日本内でつぶやかれている位置情報付きのTweetを取得。DBに登録。
Webサーバー側
リクエストがあった際に、直近のTweetをDBから取得し、まとめてJson形式で返す。
フロント側
Webサーバーに数秒ごとにデータを取得問い合わせ。
取得できたデータをGoogle Map上にinfoWindowで表示。
技術詳細
Twitter API の 「status/filter」 について
「status/filter」のドキュメントはこちら。
https://developer.twitter.com/en/docs/tweets/filter-realtime/api-reference/post-statuses-filter
取得できるTweetデータの内容はここなどを参照。
https://developer.twitter.com/en/docs/tweets/data-dictionary/overview/intro-to-tweet-json
つぶやきの位置は、下記の「bounding_box」から範囲を取得して、中央の値を計算した。
https://developer.twitter.com/en/docs/tweets/data-dictionary/overview/geo-objects
Twitterアプリケーション登録
Twitter APIを使用するには、Twitterアプリケーションに登録してコンシューマーキーなどを取得する必要あり。
下記などを参考に登録する。
https://yosiakatsuki.net/blog/create-twitter-application/
https://qiita.com/tdkn/items/521686c240b0c5bc6207
バッチ側
「status/filter」 APIをNodeから使用する
今回はNode.jsのライブラリの「Twit」というものを使用した。
https://github.com/ttezel/twit
このような処理で簡単に使える。便利。
// 左下・右上 の緯度経度で範囲を指定したもの
const area_points = [
        // 北海道
        139.317626,
        41.356195,
        149.08,
        45.802496,
        // 本州・四国
        132.194566,
        32.642942,
        143.005085,
        41.366301,
        // 九州
        128.562011,
        30.20087,
        132.130459,
        34.773467,
        // 沖縄
        123.367657,
        23.840705,
        130.48596,
        30.20087,
    ];
const twitterConf = {
    consumer_key:         '...',
    consumer_secret:      '...',
    access_token:         '...',
    access_token_secret:  '...',
    timeout_ms:           60*1000,  // optional HTTP request timeout to apply to all requests.
    strictSSL:            true,     // optional - requires SSL certificates to be valid.
};
const T = new Twit(twitterConf);
const stream = T.stream('statuses/filter', {locations: area_points});
stream.on('tweet', function (tweet) {
    // APIからデータが送られてくる度に、こちらの処理が呼び出される
    try {
        // DBへの書き込み処理等をここでやる
        console.log(tweet);
    } catch (e) {
        console.log(e);
    }
});
Webサーバー側
登録したデータをDBから取得して返すだけ。なんでもいい。
フロント側
GoogleMap上への表示方法について
今回はGoogle MapのinfoWindow上にTweetを表示した。
実際には「infobox」というライブラリを使っている。
infoboxについては下記などを参考に。
https://github.com/googlemaps/v3-utility-library/tree/master/infobox
http://htmlpreview.github.io/?https://github.com/googlemaps/v3-utility-library/blob/master/infobox/docs/reference.html
https://liginc.co.jp/344083
(ただ、指定した位置を中央にして表示する方法がわからなかったので、そのあたりをちょっと調整して使用している。)
データ取得・更新処理について
setInterval で数秒ごとにデータを取得し、最初はfadeinのCSSクラスをつけて表示させ、ある程度時間がたったらfadeoutのCSSクラスをつけて消していくようにした。
.tm-giw-fadein {
    -webkit-transition: opacity 1.0s;
    -moz-transition: opacity 1.0s;
    -ms-transition: opacity 1.0s;
    -o-transition: opacity 1.0s;
    transition: opacity 1.0s;
    opacity: 1;
}
.tm-giw-fadeout {
    -webkit-transition: opacity 1.5s;
    -moz-transition: opacity 1.5s;
    -ms-transition: opacity 1.5s;
    -o-transition: opacity 1.5s;
    transition: opacity 1.5s;
    opacity: 0;
}
以上です。令和もよろしくお願いします。
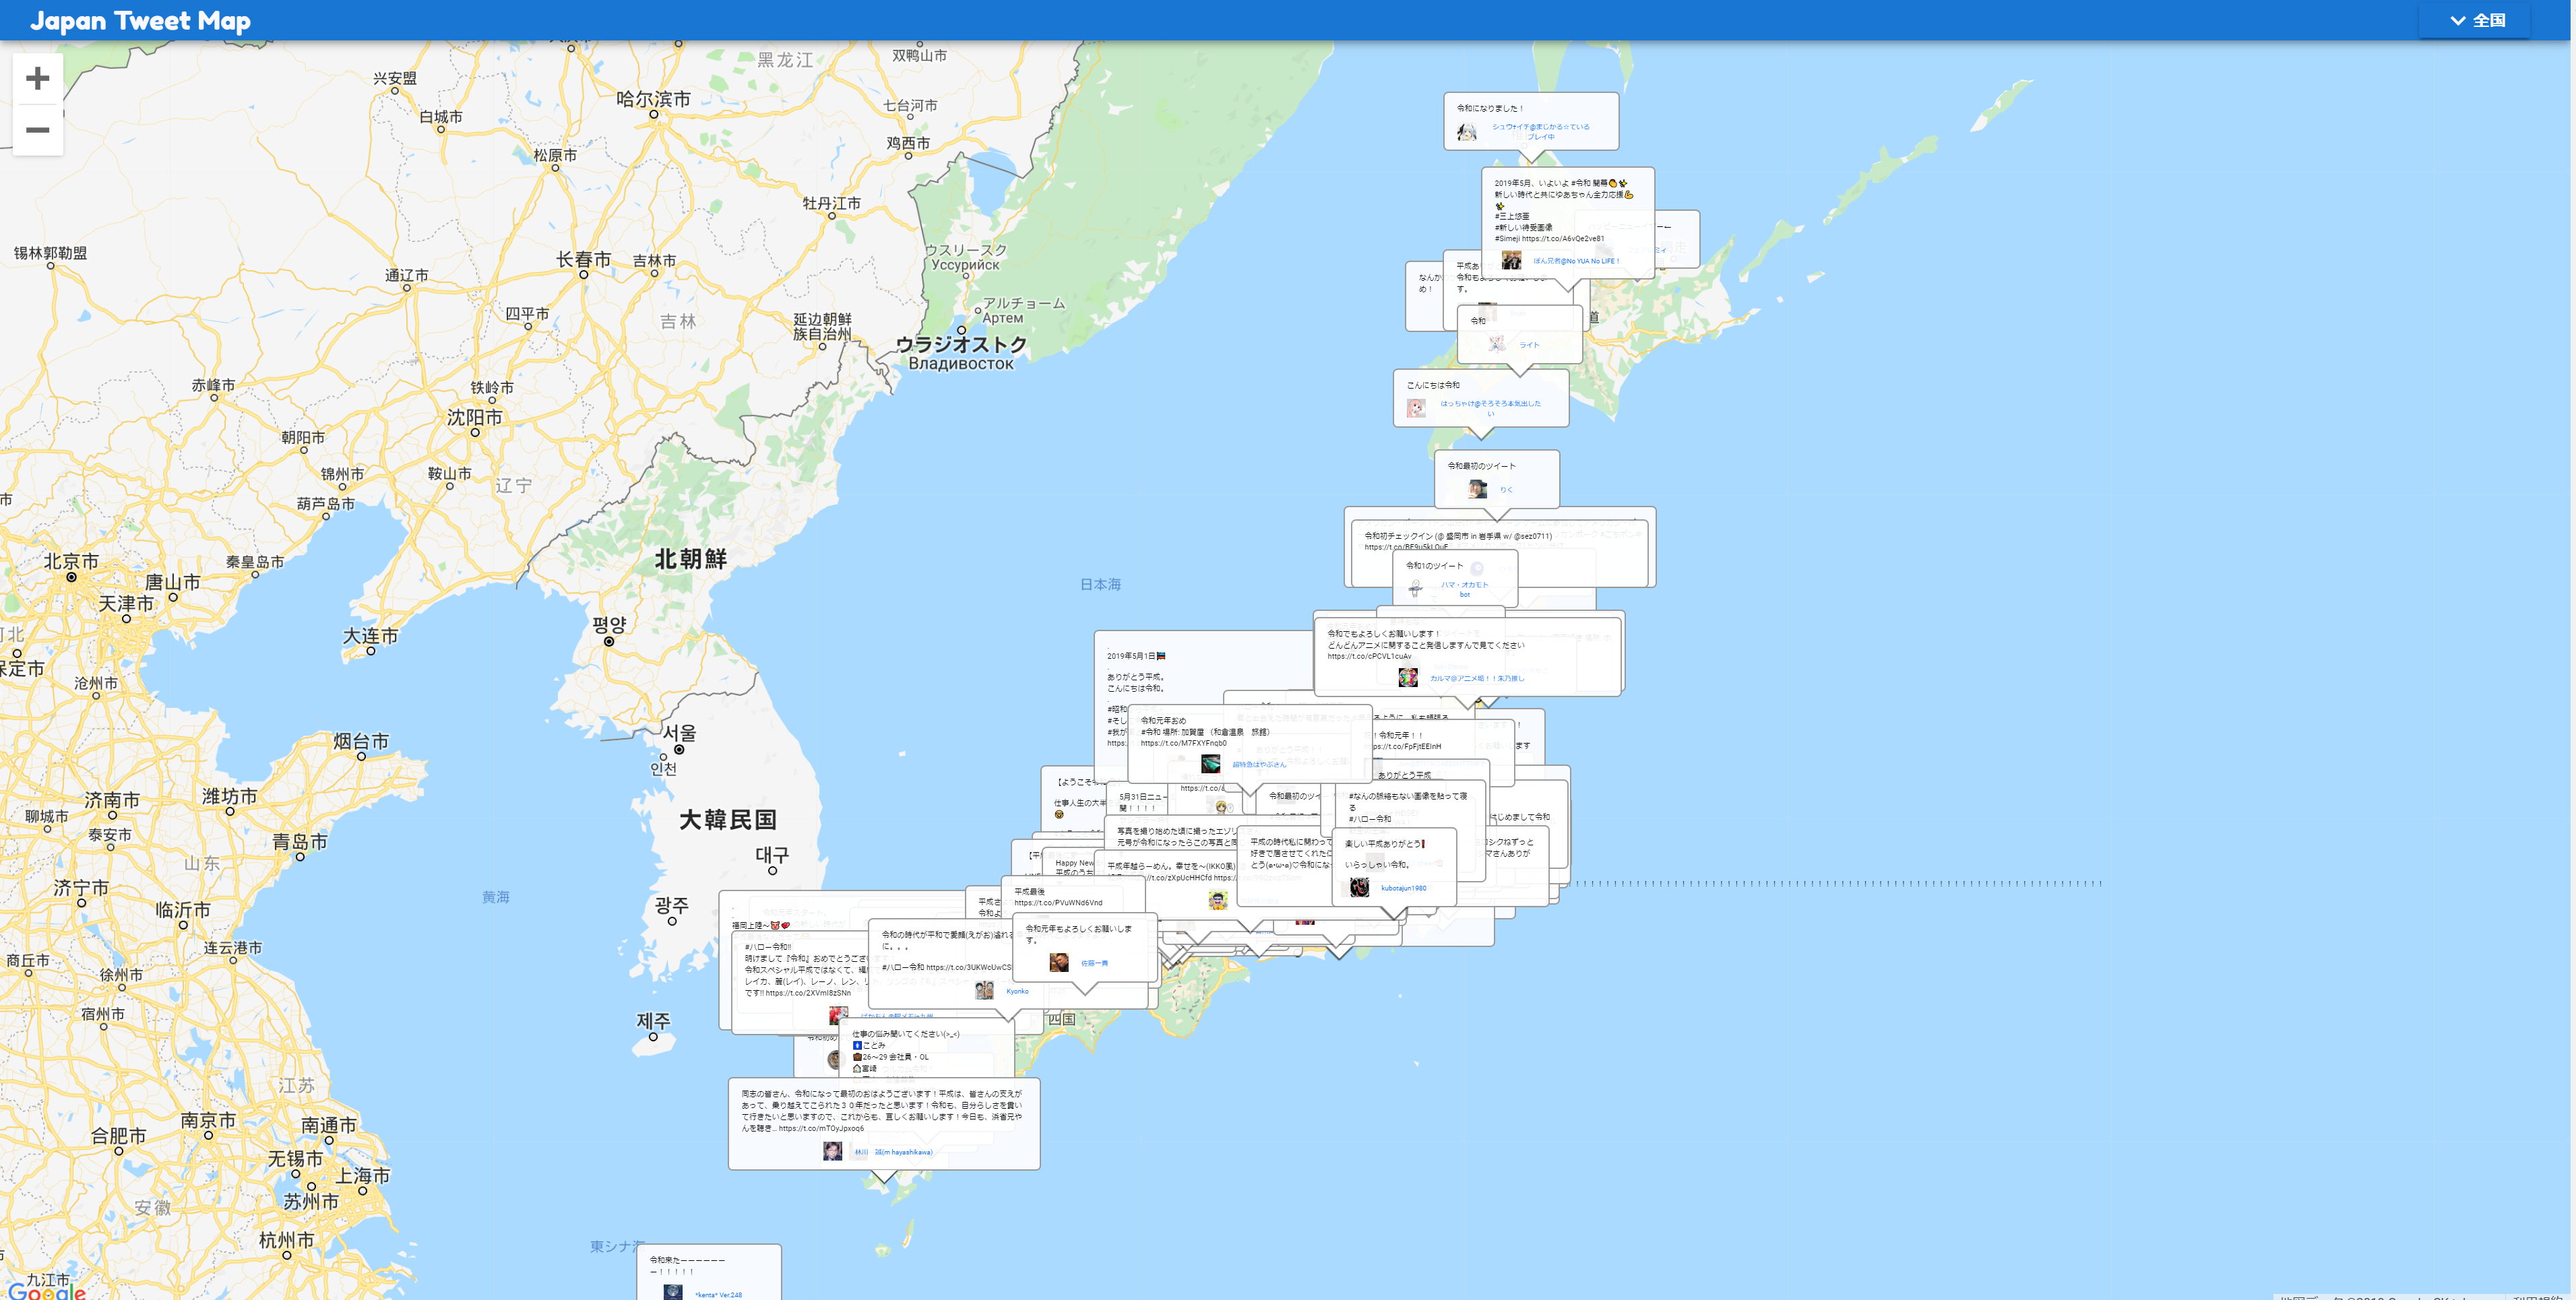
追記
令和になった時はこんな感じでした。