はじめに
この記事は Cisco Systems Japan の有志による Advent Calendar 2022 (2枚目) の 1 日目として投稿しています。
2022年版(1枚目 & 2枚目): https://qiita.com/advent-calendar/2022/cisco
今回やりたいこと
インフラ環境が完全バーチャルな場合(3rd party のデータセンタに Nutanix だけ間借りしているケースなど)、通信の可視化をしようと思っても物理的にできないケースがあります。
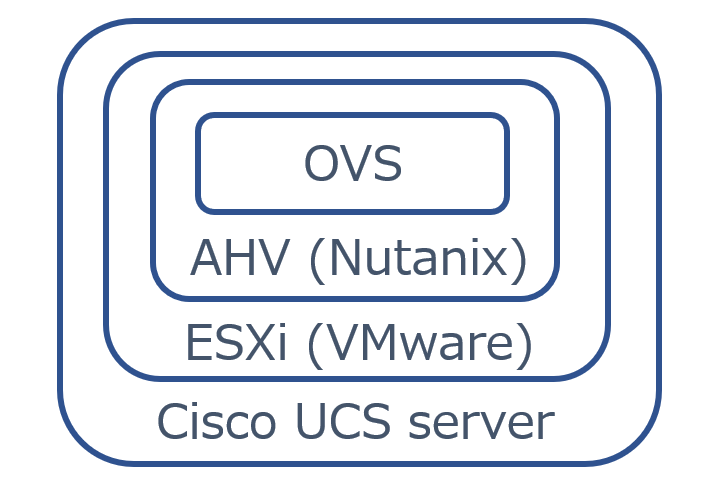
そこで、今回は Nutanix のハイパーバイザである AHV (の中の OVS : Open vSwitch) で sFlow を有効化することで通信ログの取得を試みました。
sFlow とは、さまざまなベンダの LAN スイッチに実装されるパケット・サンプリングに基づくトラフィック管理技術です(原則サンプリングデータ)。通信ログに関する IP アドレスやポート番号等の情報を取得して sFlow コレクタに送信します。
設定
まずは環境構築からです。Nutanix のハードは持ち合わせていないため Cisco UCS サーバ上に仮想的に立てることにしました。
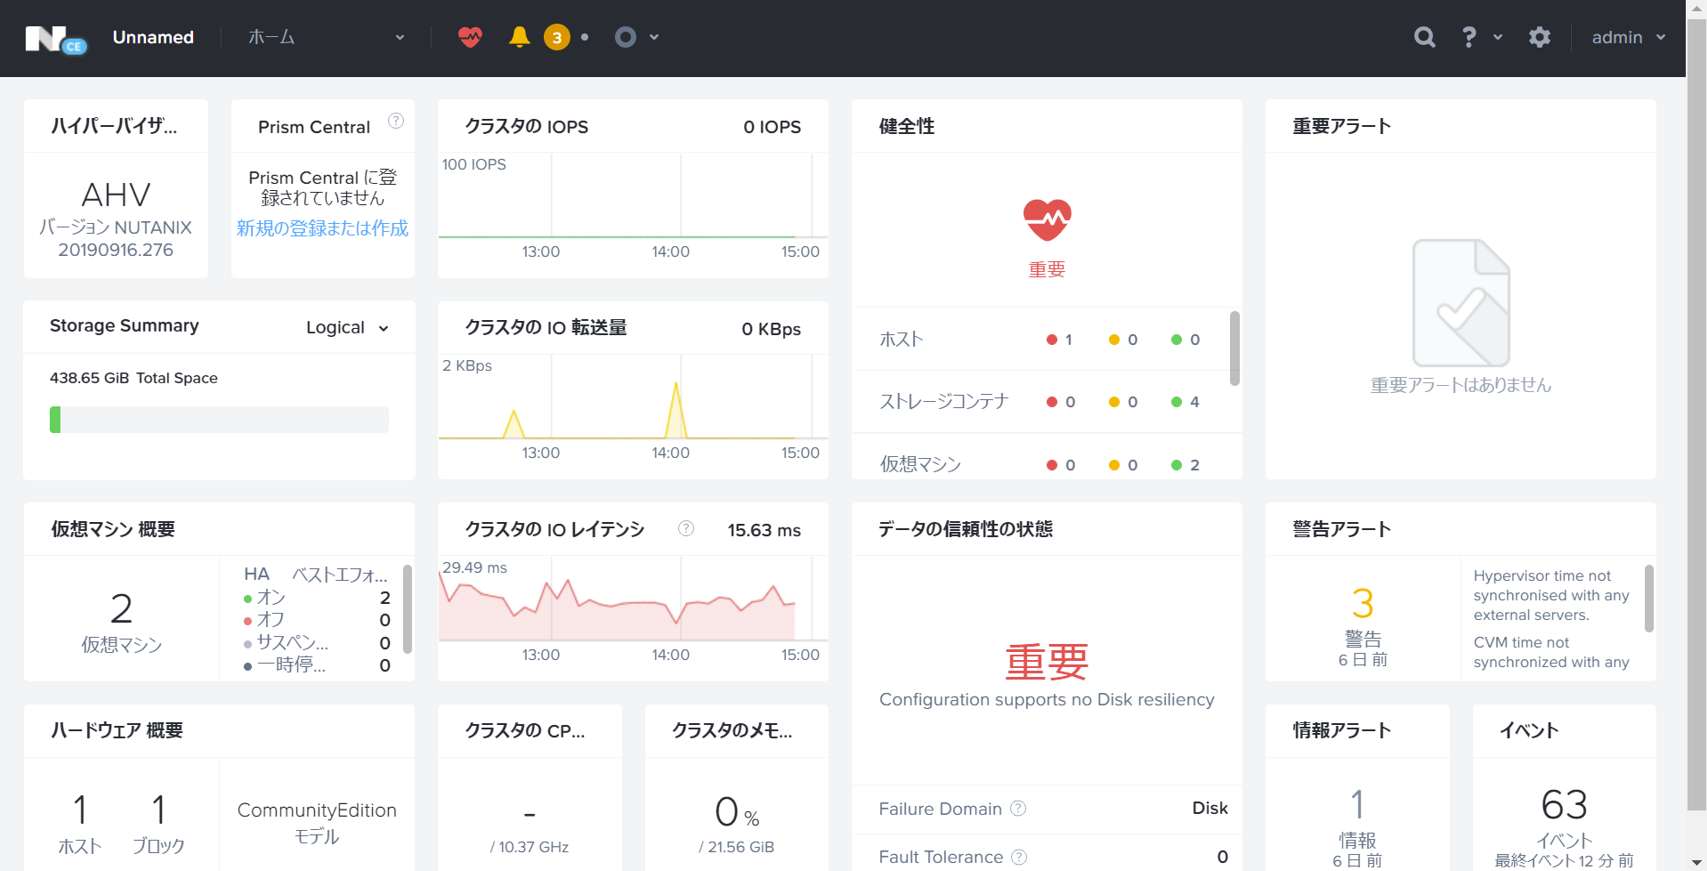
管理画面です。
次に sFlow をインストールします。
wget https://github.com/sflow/host-sflow/releases/download/v2.0.8-1/hsflowd-centos7-2.0.8-1.x86_64.rpm
rpm -ivh hsflowd-centos7-2.0.8-1.x86_64.rpm
そして sFlow ファイル (/etc/hsflowd.conf) を下記のように更新します。
# hsflowd configuration file
# http://sflow.net/host-sflow-linux-config.php

sflow {
  # ======  Agent IP selection ======
  # Selection is automatic, unless:
  # (1) override with preferred CIDR:
  #   agent.cidr = 192.168.0.0/16
  # (2) Override with interface:
  #   agent = eth0

  # ====== Sampling/Polling/Collectors ======
  # EITHER: automatic (DNS SRV+TXT from _sflow._udp):
  #   DNS-SD { }
  # OR: manual:
  #   Counter Polling:
  #     polling = 30
  #   default sampling N:
       //サンプリングレートを 50 (1/50) にするとき
       sampling = 50
  #   sampling N on interfaces with ifSpeed:
  #     sampling.100M = 100
  #     sampling.1G = 1000
  #     sampling.10G = 10000
  #     sampling.40G = 40000
  #   sampling N for apache, nginx:
  #     sampling.http = 50
  #   sampling N for application (requires json):
  #     sampling.app.myapp = 100
  #   collectors:
  //sFlow コレクタの IP アドレスを定義
  collector { ip=xxx.xxx.xxx.xxx udpport=6343 }
  #   add additional collectors here

  # ====== Local configuration ======
  # listen for JSON-encoded input:
  #   json { UDPport = 36343 }
  # PCAP+BPF packet-sampling:
  #   Bridge example:
  #     pcap { dev = docker0 }
  #   NIC example:
  #     pcap { dev = eth0 }
  #     pcap { dev = eth1 }
  #   All NICs example:
  #     pcap { speed=1G-1T }
  # NFLOG packet-sampling:
  #   nflog { group = 5  probability = 0.0025 }
  # ULOG packet-sampling:
  #   ulog { group = 1  probability = 0.0025 }
  # Nvidia NVML GPU monitoring:
  #   nvml { }
  # Xen hypervisor and VM monitoring:
  #   xen { }
  # Open vSwitch sFlow configuration:
     ovs { }
  # KVM (libvirt) hypervisor and VM monitoring:
     kvm { }
  # Docker container monitoring:
  #   docker { }
  # TCP round-trip-time/loss/jitter (requires pcap/nflog/ulog)
  #   tcp { }
  # monitoring of systemd cgroups
  #   systemd { }
  # DBUS agent
  #   dbus { }
}
設定は以上です。あとは下記のコマンドで sFlow の有効化およびモニタリングを開始します。
systemctl enable hsflowd.service
systemctl start hsflowd.service
sFlow ログの確認
Wireshark でパケットキャプチャしてみます。
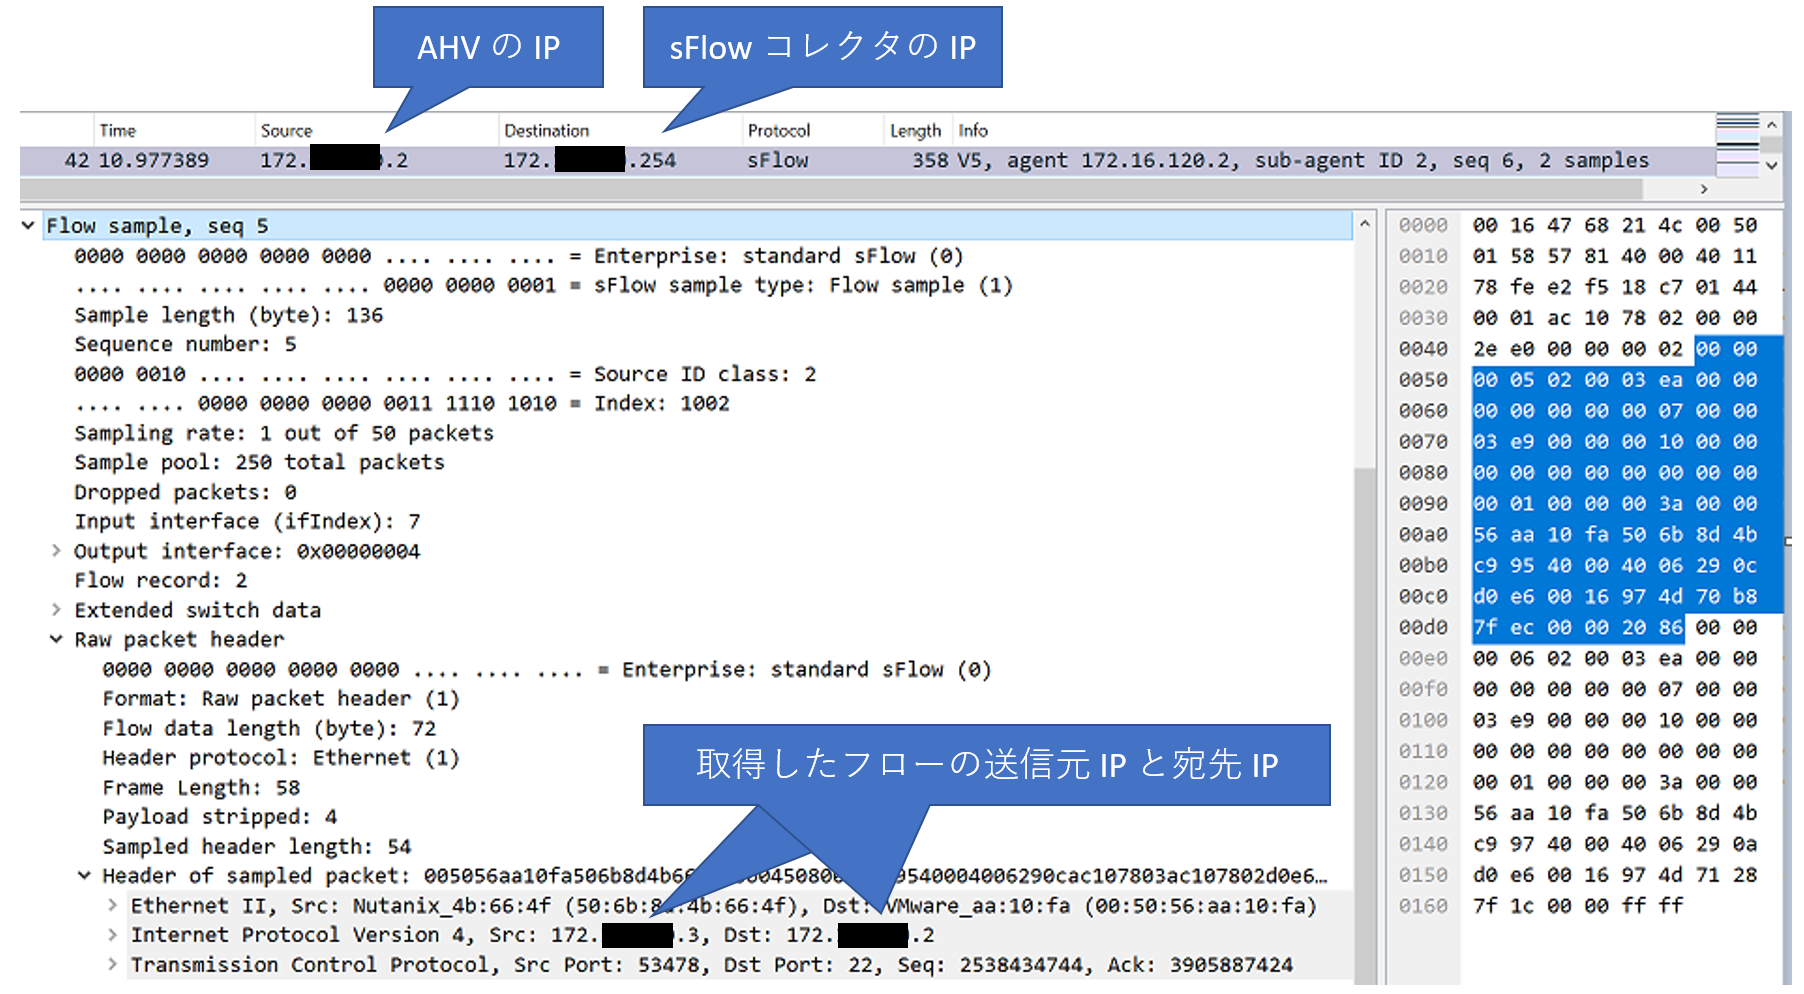
sFlow による通信ログが確認できました。
おわりに
sFlow は原則サンプリングデータにつき脅威検知のためのインプットとしてはあまり推奨されません。一方、Nutanix の中の人曰く NetFlow (IPFIX) 対応のバージョンがゆくゆくリリースされるらしいのでいつか検証してみたいと思います。