問題 twitter apiを用いて、何らかのトピックのデータを収集し、それをトレンド分析せよ。
この記事では、Twitterからデータを収集してトレンド分析をする方法について紹介します。簡単に言えば、twitter版googleトレンドみたいなことをするということです。
データ収集(Twarc2)
!pip3 install --upgrade twarc
!pip3 install --upgrade twarc-csv
まずは、tweet収集用のライブラリtwarcをインストールします。tweet収集のライブラリはいくつかありますがその中でもtwarcは比較的簡単に使うことができます。
!twarc2 configure
つづいて、Twitter DevelopersにあるBearer Token、API key、 API key secretを入力します(過去一週間を超えてツイートを収集する場合、academic apiの申請が必要です)。
!twarc2 search --archive --start-time "2022-07-02" """("ジビエ" "生食")""" tweet.jsonl
searchコマンドで検索ができます。
--archiveオプションは過去1週間よりも遡ってツイートを収集する場合に必要です。
--start-timeオプションはいつのツイートから収集するのかを指定します。
!twarc2 csv tweet.jsonl tweet.csv
データを扱いやすくするために、csvコマンドでjsonlからcsvに変換します。
Pythonによるトレンド分析
import pandas as pd
import numpy as np
import matplotlib.pyplot as plt
!pip install japanize-matplotlib
import japanize_matplotlib
必要なライブラリをインストールします。
tweet_df = pd.read_csv("/content/tweet.csv", parse_dates=['created_at'])
tweet_df['count'] = 1
tweet_trend_df = tweet_df.set_index('created_at')
ツイートが作成された時間をdatetime型で読み込むためread_csv()にparse_dates=['created_at']を指定します。
トレンド分析では一つのツイート毎に1件カウントしたいため、各ツイートのcountコラムを1にします。
最後に、プロットするためインデックスをツイートが作成された時間にします。
fig, ax = plt.subplots()
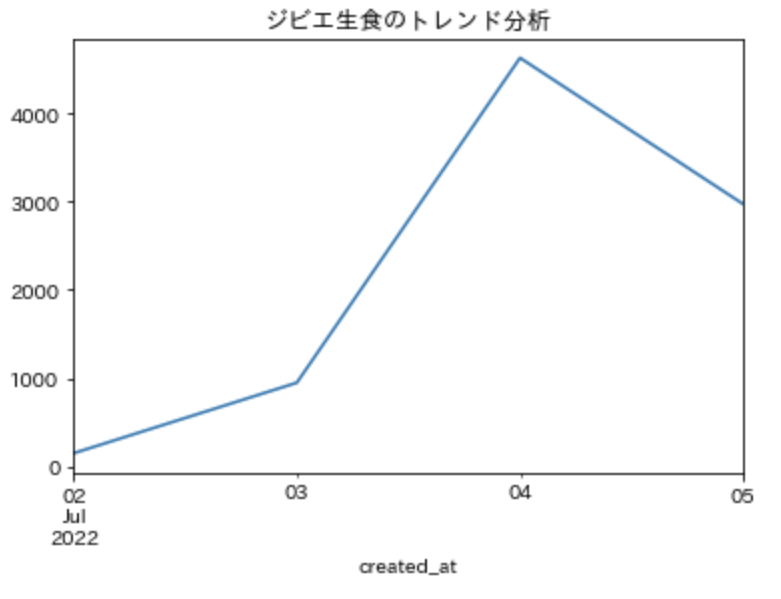
tweet_trend_df['count'].resample('D').sum().plot(title='ジビエ生食のトレンド分析');
ここでは、tweet_trend_dfのcountコラム毎に日付('D')毎に集計してそれを合計しています。
fig, ax = plt.subplots()
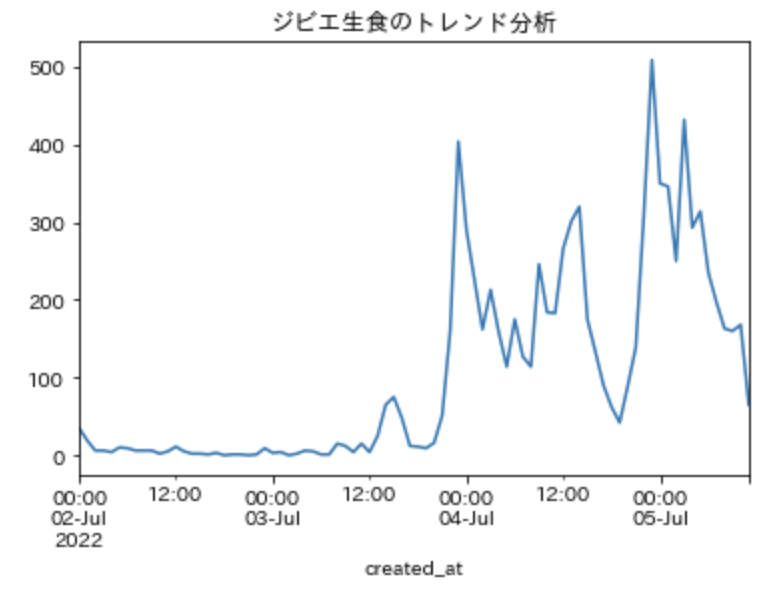
tweet_trend_df['count'].resample('H').sum().plot(title='ジビエ生食のトレンド分析');
resampleにHを指定すれば、時刻ごとの集計も可能です。
応用
ジビエの生食では、下記のツイートがよくリツイートされていたため、どれくらい影響があったのかも検討してみます。
また、下記の記事に関するツイートの影響力についても調べてみます。
tweet_with_yahoo_news_df = tweet_trend_df[tweet_trend_df['text'].str.contains("https://t.co/CWFHw1l458")]
tweet_with_retweet_df1 = tweet_trend_df[tweet_trend_df['text'].astype(str).str.contains("未だに「コオロギやセミを食べた」と言うと奇人扱いされますが")]
tweet_with_retweet_df2 = tweet_trend_df[tweet_trend_df['text'].astype(str).str.contains("ジビエ生食が表に出る度に")]
tweet_with_retweet_df3 = tweet_trend_df[tweet_trend_df['text'].astype(str).str.contains("ここ数日鶏肉や鹿肉などのジビエの生食に")]

fig, ax = plt.subplots()
tweet_trend_df['count'].resample('H').sum().plot(title='ジビエ生食のトレンド分析');
tweet_with_yahoo_news_df['count'].resample('H').sum().plot();
tweet_with_retweet_df1['count'].resample('H').sum().plot();
tweet_with_retweet_df2['count'].resample('H').sum().plot();
tweet_with_retweet_df3['count'].resample('H').sum().plot();
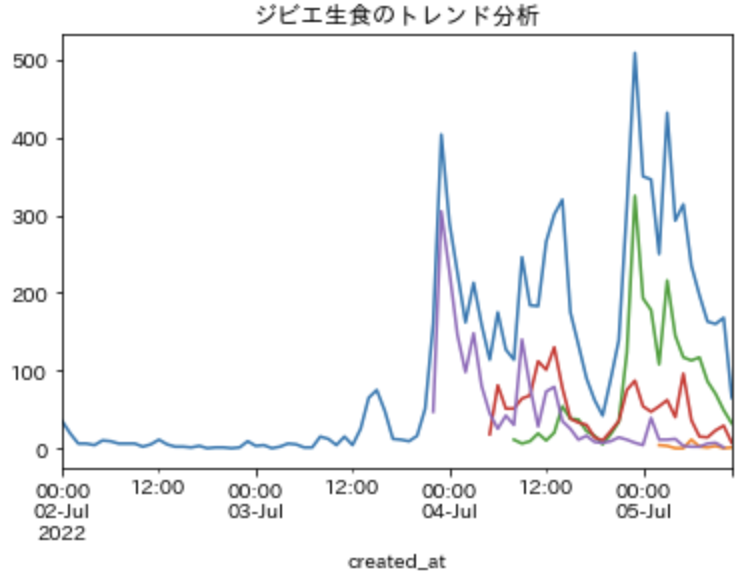
リツイートが大半を占めていること、記事の影響力はそれほどないことがわかります。