問題 アメリカにおける民主党と共和党の演説テキストにおける単語頻度の比較を可視化せよ(shiftraitor, scattertext)
この記事では2つの文書における単語頻度を可視化する方法について紹介する。データセットはKaggleにある大統領のスピーチデータセットを用いる。sixth_party_corpus.csvが1964年から現在までのデータであるため、このデータセットを用いて民主党と共和党の演説における単語頻度を可視化してみよう。
この記事ではshifterator, scattertextを用いる。まずは、ライブラリをインストールしてみよう。
!pip install -U shifterator, scattertext
import pandas as pd

from sklearn.feature_extraction.text import CountVectorizer

import scattertext as st
from shifterator import shifts as ss
import shifterator

from IPython.core.display import HTML
続いて、Kaglleからダウンロードしたデータを読み込んでみる。
sixth_party_df = pd.read_csv("/content/sixth_party_corpus.csv").rename(columns={"Unnamed: 0":"name"})
sixth_party_df.head(5)
shifterator
まずは、shifteratorから始める。共和党と民主党毎に演説のtextを結合し、単語文書行列を作成する。
republican_text = ''
for t in sixth_party_df.query('Party=="Republican"').transcripts:
    republican_text += t

democratic_text = ''
for t in sixth_party_df.query('Party=="Democratic"').transcripts:
    democratic_text += t

text = [republican_text, democratic_text]

vec_count = CountVectorizer()
vec_count.fit(text)
X = vec_count.transform(text)
text_df = pd.DataFrame(X.toarray(), columns=vec_count.get_feature_names()).T.rename(columns={0:'republican', 1:'democratic'})
text_df
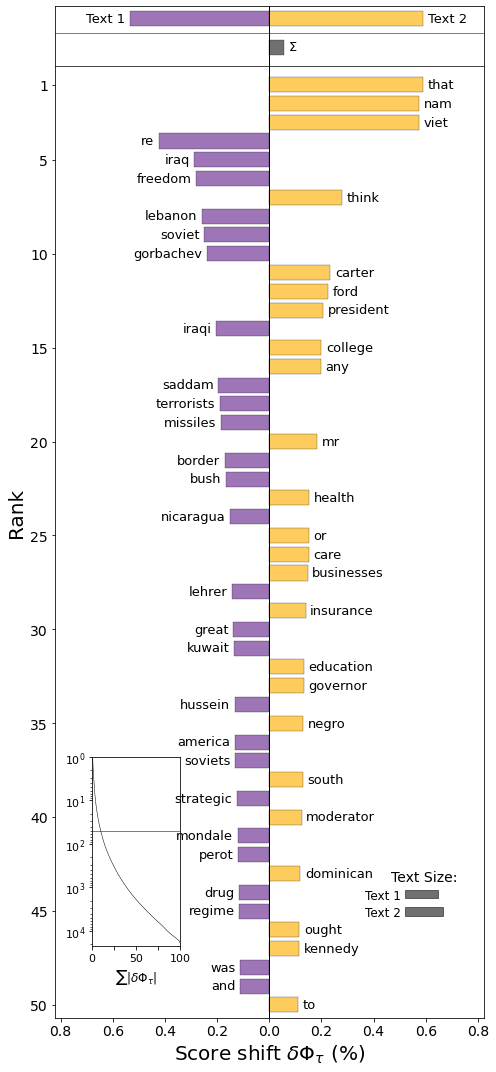
最後にshiftraitorを用いて可視化する。
shift = ss.JSDivergenceShift(text_df['republican'].to_dict(),text_df['democratic'].to_dict(), base=2)
shift.get_shift_graph(top_n=50)
thatやthinkなどの単語が上位に来ていることから前処理の必要性を感じさせられるが、共和党の演説では、「イラク」、「テロリスト」、「ドラッグ」などの単語を用いていることがわかる。「自由」はどちらかといえばリベラルな単語だと思われるが、共和党の方が用いられているのも興味深い。
scattertext
続いて、scattertextについて見ていく。まず、CorpusFromPandasを用いて、DataFrameからコーパスを作成する。
corpus = (st.CorpusFromPandas(sixth_party_df,
                              category_col='Party',
                              text_col='transcripts',
                              nlp = st.whitespace_nlp_with_sentences
                              )
          .build())
そして、produce_frequency_explorerを用いて、プロットする。
html = st.produce_frequency_explorer(corpus,
                                     category='Democratic',
                                     category_name='Democratic',
                                     not_category_name='Republican',
                                     metadata=sixth_party_df['Party'],
                                     term_scorer=st.RankDifference(),
                                     grey_threshold=0)
HTML(html)
表の見方については、右上に行くほど単語の頻度が高く左下に行くほど単語の頻度が低い、左上に行くほど民主党での単語の頻度が高く右下に行くほど共和党での単語の頻度が高いということになる。
どちらを使うべきか?
scattertextは綺麗なプロットができるが単語数が少ない場合、疎な図になってしまう。対して、shifteratorは多くの単語数をプロットするのには向かない。そのため、単語数が多ければ前者、単語数が少なければ後者を用いるという感じで使い分ければいい。
quanteda
Rで単語頻度の比較を可視化したい場合はquantedaがある。
install.packages("quanteda")
install.packages("quanteda.textstats")
install.packages("quanteda.textplots")
Rでやる場合は次のように書く。
sixth_party_df <- read.csv("/content/sixth_party_corpus.csv")

republican_df <- sixth_party_df %>% filter(Party == "Republican")
republican_text <- ''
for (i in 1:length(republican_text)){
    republican_text <- paste(republican_text, republican_df$transcripts[i])
}
republican_dfm <- dfm(republican_text)
rownames(republican_dfm) <- "republican"

democratic_df <- sixth_party_df %>% filter(Party == "Democratic")
democratic_text <- ''
for (i in 1:length(democratic_text)){
    democratic_text <- paste(democratic_text, democratic_df$transcripts[i])
}
democratic_dfm <- dfm(democratic_text)
rownames(democratic_dfm) <- "democratic"
dfm <- rbind(republican_dfm,democratic_dfm)

result_keyness <- textstat_keyness(dfm, target = "republican")
textplot_keyness(result_keyness)
参考文献
shifterator
scattertext
quanteda


