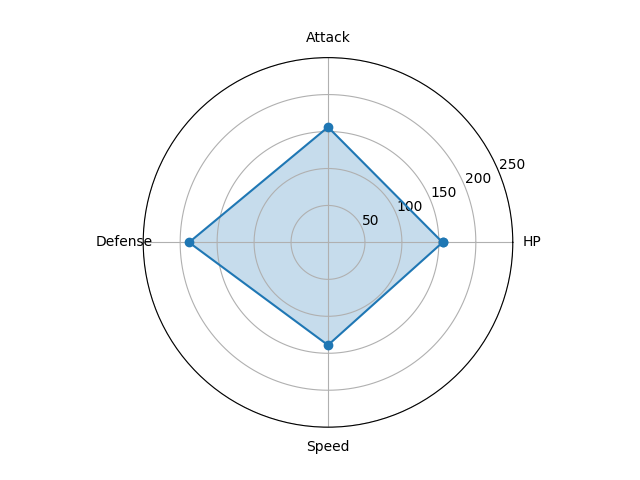
サンプル
モチベーション
- 公式のサンプルはうまくプロットできないし、コードが長くて死ぬ。
- シンプルにレーダーチャートを描きたいだけなのに…。
コード
import matplotlib.pyplot as plt
import numpy as np

def plot_polar(labels, values, imgname):
    angles = np.linspace(0, 2 * np.pi, len(labels) + 1, endpoint=True)
    values = np.concatenate((values, [values[0]]))  # 閉じた多角形にする
    fig = plt.figure()
    ax = fig.add_subplot(111, polar=True)
    ax.plot(angles, values, 'o-')  # 外枠
    ax.fill(angles, values, alpha=0.25)  # 塗りつぶし
    ax.set_thetagrids(angles[:-1] * 180 / np.pi, labels)  # 軸ラベル
    ax.set_rlim(0 ,250)
    fig.savefig(imgname)
    plt.close(fig)

labels = ['HP', 'Attack', 'Defense', 'Speed']
values = [155, 156, 188, 139]
plot_polar(labels, values, "radar.png")
要約すると
- 極座標のAxesオブジェクトを作って、
- そこにポリゴンを描画する。
- 塗りつぶしても良し。
凡例やタイトルの追加、複数データのプロットは通常のグラフ同様にできるので省略。
