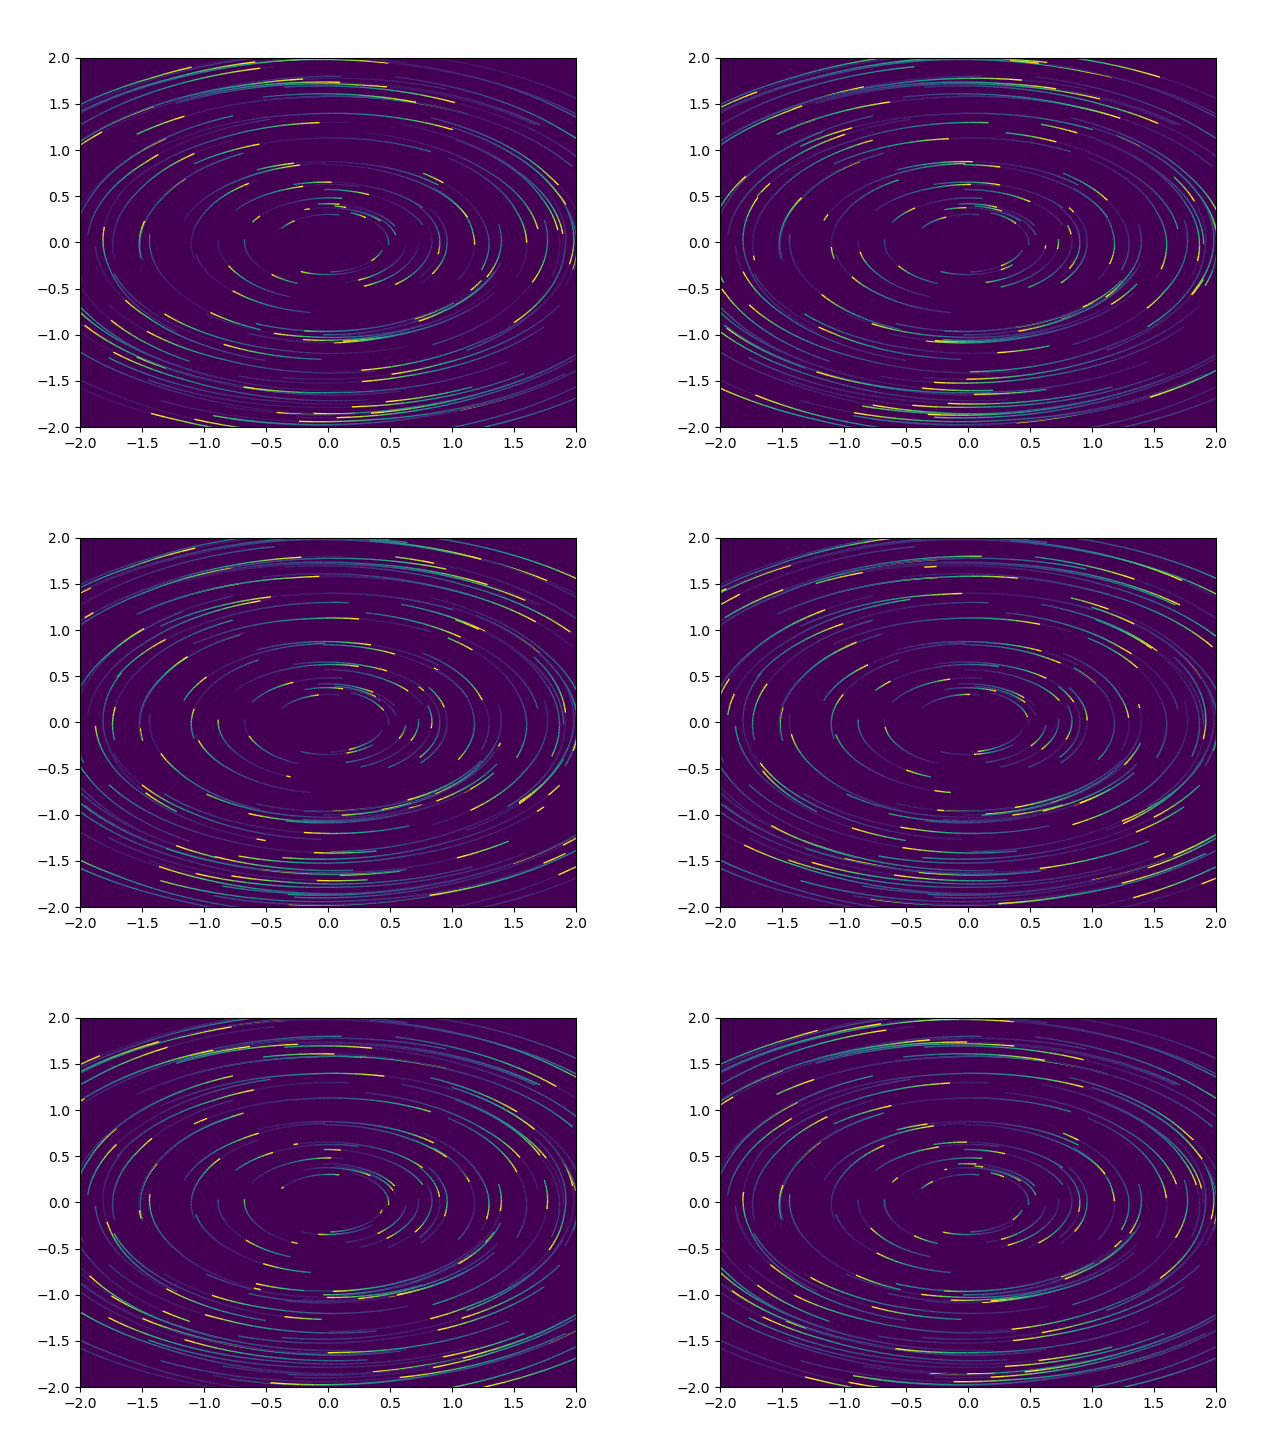
二次元定常流の見やすい可視化をPythonで使いたい
元ネタ
- こちらのMatlabで書かれた記事を直接参考にしました https://ichiro-maruta.blogspot.com/2017/09/blog-post.html?m=1
- このグループが2012にやったのが初出のようだ http://hint.fm/projects/wind/
仕組み
- まずnl個の仮想粒子を置いて、それぞれについて与えられたベクトル場に基づいて流線(streamline)を計算し、(nt + 1)ステップ分の座標を保存します(get_streamlines)
- 湧出し点でスカスカにならないよう、(nt + 1)ステップのうち真ん中を乱数で与えました
- nl個の流線それぞれについて、nt個のセグメントを時刻の関数で色付けします(plot_snap)
- ループで表示します(plot_anime、トップ画)
- わずかnt = 30枚のループですが、ループしているようには見えないのではないでしょうか?nl個の流線それぞれについて、時刻をズラしているのがミソのようです
- (x, y) = (-0.3, -0.3)辺りから生えてる流線を追ってみるのが分かりやすいと思います
コード
https://gist.github.com/ysdtkm/007e39824992f0b5085f37e487c6cdd4
注意: rm -rf imgを含みます。何もない場所で実行してください
発展
- 非定常流への拡張
- Cartopy等と連携して地図上の曲がった座標系でプロット
